Managing Service Profitability in the Age of Digital Transformation

Editor’s note: This post was co-written by Joe Kenny and Coen Jeukens.

It is an age-old dilemma for Operations Managers. Your CEO wants XX% revenue growth, your CFO wants XX% cost reduction, your CRO wants better references and higher NPS scores, and you are supposed to deliver all of this with zero additional investment, because – of course – you have been doing this for years with no additional cash, so why would you need it now?

To top all of this off, you had very little idea of where you stood, operationally or financially, at any given time. And this was due to the fact that access to real-time data, a current view into work in process, and accurate financial information was all impossible to come by.

Historical challenges for service operations

I often speak at conferences and participate in webinars, and I often relate this anecdote – in March I would lay out my operational plan, based on the most recent P&L statement I had received (January’s), intending to address performance weaknesses I had uncovered. My team would execute the plan and in May I would receive my March P&L to see if the response to January’s performance shortfalls were successful or not. It was madness.

Now, layer onto that, the fact that 30, 60, 90-day invoicing accruals were also Operation’s responsibility, even though we had an AP department. This process greatly impacted both revenue and cost, as the cost of service was consumed, but the associated revenue may not have arrived in 90 days.

Impact of digital transformation

Fast forward to today, and service operations managers have been given a lifeline—digital transformation. Digital transformation can be like a light switch, illuminating what is happening in real time, allowing service operations leaders to adapt to circumstances immediately. They can reallocate precious resources instantly, validate payment status and credit status prior to service delivery, and see and understand the impact of operational plans in real time.

Digital asset and service management platforms can provide real-time performance measurements, both foundational and top line. This includes data round first-time fix rate, mean time to repair, mean time between failures, and equipment uptime. With this data, operations managers can organize and drive for peak utilization of labor resources while ensuring that the training and quality of work are optimal. This then increases the efficiency of their organization and lowers the cost to deliver excellent service.

With today’s technology, service operations are finally on par with our commercial partners and can see and act on upsell, cross sell, renewals, and service contract extensions instantaneously. In addition, we can support sales by identifying and helping them target competitors’ equipment for targeted replacement. We are the eyes of the commercial team on the customer’s location.

Newfound financial control

Utilizing a digital solution allows for real-time tracking of labor, parts consumed, travel, and any other costs associated with a service call, regardless of whether it is a T&M call or in support of a warranty/service contract entitlement. This is a key advantage that enables service operations leaders to manage labor and parts expenses far more granularly. In addition, they can evaluate the revenue associated with the service provided to validate if the pricing is correct based on their revenue and margin targets.

This ability to understand the cost to serve on an asset or entitlement agreement in real time is a huge step forward for service operations. It gives them the data they need to truly align entitlement pricing, cost control, operational efficiency, and productivity to accurately manage and forecast their performance and address fundamental issues that are obstacles to achieving their own performance objectives.

The evolution of equipment and asset service management platforms has greatly assisted service operations professionals in attaining the insight, visibility, and control that their commercial and financial counterparts have enjoyed for decades. As asset and equipment maintenance and service becomes a larger part of most organizations’ revenue and margin contributions, it is important that they equip teams with the technology that enables them to better manage and control their operations.

Published on PTC Blog.

Rental in Transition

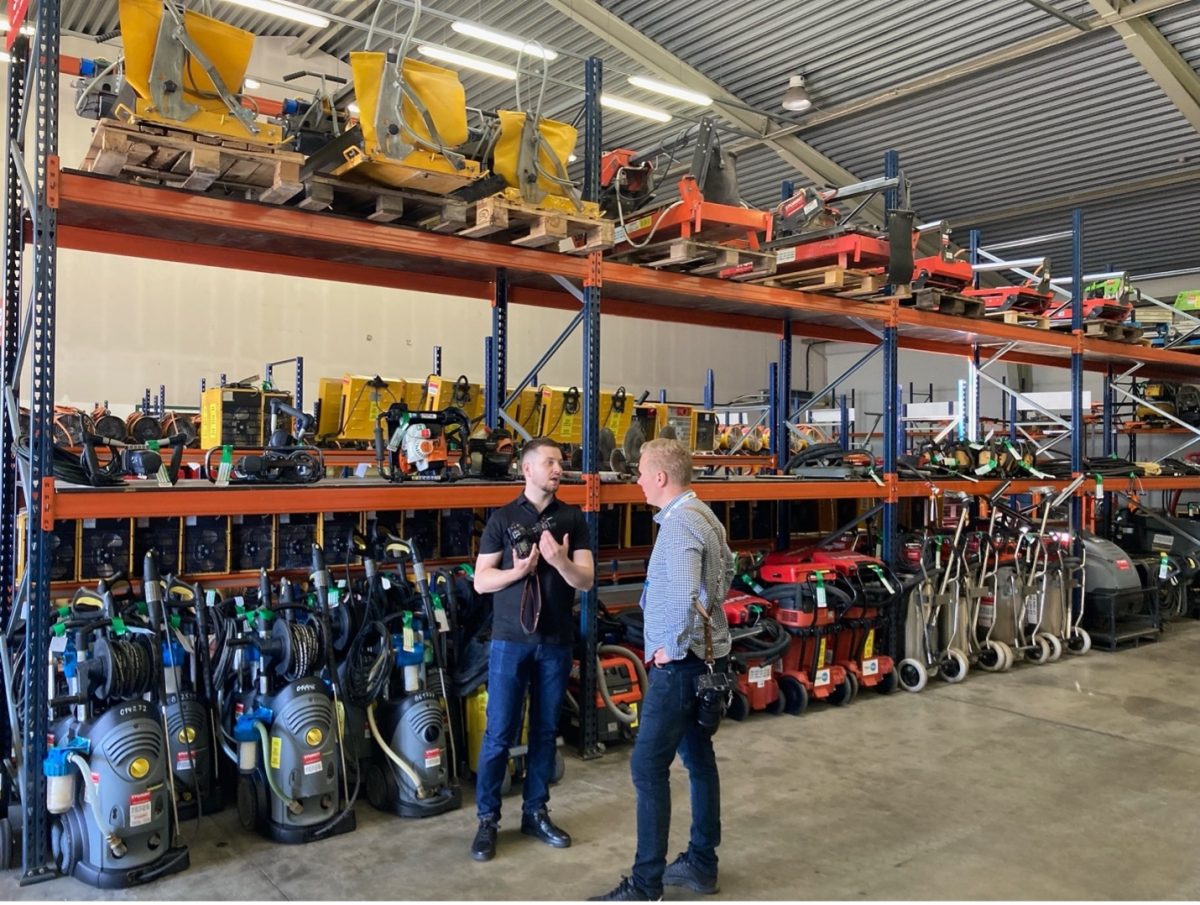
Last week I went to Riga to participate in the annual convention of the European Rental Association. With the theme ‘Rental in Transition’ the convention rightfully worded the pivotal junction in time. Fuelled by the European Green Deal we are poised to rebuild our economy towards net zero emmisions. This means construction will boom requiring lots of construction equipment. The big challenge for OEM, dealer, rental and construction companies will be to manage the installed base of construction equipment from a carbon footprint and emmisions perspective.

Collective bargaining

When the representative of the EU, the consultant from the Boston Consulting Group and the chairman of the European Construction Industry Federation talked about the need and drivers for transition, I had this nagging question. Suppose I own a construction equipment fleet of 1b$, the majority still being internal combustion engine (ICE) based, how do I monetise that investment if the awarding of new construction jobs is based on lower carbon footprint and emission levels?

This is big. This is a challenge of major proportions. Though the delegates subscribed to the mid-term sustainability and transformation goals, for the short-term there’s that ominous questionmark of the how-to. The impact and magnititude of the sustainability transition shows how OEM, dealer, rental, construction companies and legislators are intertwined. This requires a serious dose of collective bargaining.

Preparing for the transition

Regardless of how the transition is going to pan out, for all players in the value chain it is imperative to prepare for the transition. It will become increasingly important to understand the usage profile of construction equipment versus generic equipment attributes.

Let me explain with an example in the car rental industry. When you rent a car it typically comes with a mileage allotment per day. If you drive more, you pay more. If you drive less you still pay the daily rate. You could also split the rental model in an ‘availability’ and ‘usage’ component. Especially if the usage component drives carbon and emissions output, splitting the rental model can motivate the user for a more sustainable use.

This simple example sits at the core of asset-centric business models. It’s not about owning of having an asset, it’s about using it. See here the incentive to digitally transform your business and get access to equipment usage information. Bye the way, if you are catering to the larger construction companies, you will know that providing the usage data of construction equipment is a critical element of the rental service.

Carbon offsetting

Most of the delegates flew to Riga. Upon buying their airline ticket each had a possibility to purchase the carbon-offsetting option. How many did buy that option? Today the majority of the rental companies offer a similar carbon-offsetting option for rental equipment. How often is that option selected? A brief survey amonst the delegates revealed the non-scientific value of ±5%. Rental today is a very price sensitive industry.

When I look at the construction deadlock in my own country, the Netherlands, I see that each new project must submit a carbon and emissions overview before even getting a building permit. We heard the EU representative make remarks along similar lines. “We will use carrot and stick”. And we know of sustainability-forefront-cities only awarding projects to eco-frontrunners.

Does this mean that we can only use electric or hydrogen based equipment for future construction projects? Contemplating on the sheer size of the sustainability challenge, the answer will be ‘no’. There simply isn’t enough construction equipment to get all the work done. But if you want to continue using ICE equipment, you need to get smart at carbon-offsetting options. At the conference we heard that a CO2 calculator is a good start, but we need to make it easier to use and equipment usage based.

Beyond Equipment

For the mid and longer term we have an adject challenge when replacing ICE equipment with electric and hydrogen based alternatives. For ICE equipment we can build on the existing infrastructure of fosile fuels. And for remote locations we can very easy offer a fuel management option. 

If we want to deploy electric and hydrogen based equipment, it often means we have to supply the complete EV or hydrogen powertrain as well. This implies that the rental paradigm will change from equipment rental to complete solutions rental. From an asset management and equipment availability perspective that will mean that the complexity will increase. This will feed the argument for accelerated digital transformation.

In completely different acumen we could label this as ‘servitisation’. When the contractor needs to excavate 100 tonnes of rock, he’ll need an excavator, dumpster truck and complete power train. As food for thought for rental, would it be too far off to start selling electricity/ hydrogen as well?

Beyond Riga

It was great to be in Riga. To hear so many people in the industry. The challenge is big. Yes, there are some threats. Yes, there is a level of denial and green-washing too. On the other hand, the challenge provides a great number of opportunities too. Those who embrace those challenges and embark on their digital transformation journey, those will have the upper hand in a rental market that is in transition.

This article is published on Field Service Digital.

Previous blog on rental.

Managing product recalls – five keys to success

As an equipment manufacturer, you hope a product recall never happens. In reality, most OEMs have their share of misfortune. The recent example of Philips apnea machines shows how complex a recall process can be. How it can get out of hand. How it can impact your brand experience. Instead of trying to avoid product recalls it is better to be prepared for them.

Preparing for the unlikely

Every product is designed with a set of checks and balances. In the final stages, before general availability, Quality Control assesses safety and fit-for-purpose. Once the product hits the market in grand(er) volumes, the OEM will receive a much larger dataset telling how the product performs and behaves in real-life situations. That is, if the OEM has set up a channel to listen.

When you’re in the middle of a product recall, all stakeholders will be aligned and feel the sense of urgency of using data to mitigate the quality issue. If you hadn’t setup a data collection process, the ability to reconstruct the data is limited and likely comes at a high cost. You’ll also have to be mindful that a product recall is a period of anxiety to both the OEM executives as well as the owners of the affected products.

In our practise, we see that companies that come prepared experience lower costs and higher customer loyalty. These benefits are incentivising other OEMs to follow suit. Especially when the pace of launching new products is increasing and quality assurance is under duress.

Gaining installed base visibility

In an ideal world, any OEM would love to know where each product sold is installed, in what state it is, and how it is being used. The value of that data will enable the OEM to develop better products, be more efficient in their service delivery, and increase their service revenue through hyper-personalized service offerings.

In the real world, we see a lot of OEMs struggling with their installed base visibility. And this is a real problem. If you don’t see your installed base, how do you expect to be efficient in service delivery and driving revenue from that base? It becomes really problematic when you have a quality issue with a product and you don’t know where they are.

Managing the indirect sales channel

The apnea case shows the recall struggle in its extreme. On the one hand the OEM has a medical compliance obligation to manage the product recall and replacement. On the other hand, the OEM has no visibility on who owns them, because the bulk of the units were sold via the indirect sales channel. 

Though the OEM does not have visibility on the end-user of the affected units, the OEM does have a record of the serial numbers sent to the dealers/resellers. Those dealer/ resellers ‘own’ the commercial relationship with the end-user, potentially having sold a service contract too. In this model, the OEM is the orchestrator of the recall, whereas the dealer/resellers are the eyes, ears and hands.

Prioritizing the roll out

Once the OEM has diagnosed the product issue and created an engineering change, the complete supply chain needs restocking. First, the faulty components need to be recalled, to avoid a widening of the quality issue. Then, the new components start to fill the pipeline to enable the roll-out. 

Because the production of the new component version needs to ramp up, there is a constrained supply in the early days of the recall, which is a form of service campaign. At the same time, vocal customers will demand instant replacement. Scarcity will require the OEM to make choices and communicate them.

If the OEM only has information on shipping volumes to dealers/resellers, prioritization options are coarse. That becomes more apparent when the dealer/reseller has sold a ‘gold’ contract to the end-user. The end-user has a perception that it purchased an OEM product with an associated gold contract, oblivious to the fact that both elements are delivered by two different commercial and legal entities. That becomes an interesting prioritization puzzle and can become a cause for discontent when not accounted for.

Monitoring the service campaign

Now let’s assume you are in the middle of rolling out the engineering change to your installed base. How do you know you are done? When have you successfully completed the product recall and can you prove that you are compliant?

Based on our conversations with OEMs, we’re hearing a need for a workbench-like tool to slice the installed based according to multiple and changing criteria, while maintaining an overview of progress and cost. Last but not least, having tools to prove you’ve done the work and communicate that to the involved stakeholders. At ServiceMax, we’ve bundled these capabilities as Service Campaigns enabling any OEM to be prepared and enabled for future product recalls.

This article is published on Diginomica and Field Service Digital.

Why you should put service campaigns at the heart of your go-to-market

It’s common sense that owners of products, equipment and assets want a maximum of uptime at minimal operational cost. But how much emphasis does this get in the procurement cycle? For many buyers, it is difficult to define the service requirements over a multi year lifecycle. At the same time, buyers do have implicit expectations regarding lifecycle support, often derived from brand perceptions. This is a nice mix for OEM’s to strategize on.

The bulk of lifecycle cost is in operating the asset

To create an asset lifecycle strategy we will have to look at it from cradle to grave, including both the OEM and the asset owner’s perspective. In the following picture you can see the cost elements that go into each phase.

Lifecycle of assets and costs © ServiceMax

What you can see in the picture is that the cost of operating and maintaining the asset is typically a multiple of the cost of acquiring the asset. In the image from Accenture below, the ratio between product expenditure (capex) and the service expenditures (opex) comes to life. For example, if you had purchased a piece of industrial equipment for $1m, you would spend an additional $7.3m over its lifecycle to keep it running.

Initial product purchase relative to total product lifecycle cost © ServiceMax

Nominal output of the asset

Let’s go back one step. Why does somebody buy an asset? Not for the pleasure of owning it, but to use it. In using it, the asset produces a nominal output/outcome, and that generates value for the asset owner. To maintain the nominal output while wear-and-tear is degrading the asset, a mitigating lifecycle strategy needs to be put in place to secure the value potential of the asset. The following picture shows a typical asset lifecycle.

Typical asset lifecycle © ServiceMax

In this picture you’ll see service interventions like preventive maintenance and break-fix that serve the purpose of uptime. An intervention like an engineering change serves the purpose of prolonging the lifecycle of the asset as well as potentially boosting the original nominal output.

  • Extending lifecycle: mid-life upgrade, retrofit or overhaul.
  • Expanding output: booster-packs, product or software upgrades.

Product engineering beyond Point-of-Sale

Both extending the lifecycle and expanding the nominal output of an asset can be plotted against the continuous process of product engineering. Once a product hits the street, engineering receives feedback on its use through quality, warranty and maintenance channels.

Acting on asset feedback, engineering can design newer revisions of that product as well as define upgrade and booster offerings for the existing installed base.

For some OEM’s the asset feedback loop is an integral part of their Go-to-Market. Imagine you operate in an very competitive and tech savvy market. Timing is essential in building market share. At ServiceMax, we’ve come across OEM’s that go GA with a product when engineering is at 80%. They use the service organization to ‘bestow’ the customer with goodness and attention to make up for the missing 20%. In doing so, the service organization retrieves relevant intelligence to complete the engineering process. As part of the deal, the customer gets the benefit of both the latest technology as well as engineering changes post-point-of-sale. A win-win for both OEM and asset owner.

Using the product lifecyle as a means to customer intimacy

Whether you launch your product at 80% engineering completeness or at 100%, most OEM’s will continue to engineer their product beyond GA. The question is, how would you like to make those product improvements and engineering changes accessible to your existing installed base. In other words, have you setup a process to manage asset lifecycle service campaigns?

Service campaigns can stem from two different emotions. A negative and a positive one. In the end, when you manage your campaigns well, you’ll achieve higher levels of customer intimacy.

  • Negative emotions: These are quality and complaint driven engineering changes. A customer expects a certain quality and nominal output level, but is not getting it. The customer expects the supplier to fix it as quick as possible at no extra cost. Though a complaint and quality issue may start as a negative emotion, an OEM’s capability to act on it determines if the emotion remains negative or turns positive. In addition, service campaign capabilities will deliver efficiency and compliance benefits to the OEM.
  • Positive emotions: These are engineering changes that will enhance the capabilities of the asset. As such, you go above and beyond the nominal output specifications promised at point-of-sale. In general customers will perceive this as a positive, adding credibility to the OEM’s leadership and brand value. With service campaigns an OEM can reinforce that positive emotion as well as monetize it.

Service campaigns drive pro-active service

If customers buy assets to use them, OEM’s are very well positioned to facilitate the usage of those assets throughout their lifecycle. The OEM designed the product. The OEM has all the expert knowledge of how and why the product works. Now, if the OEM gets feedback on how each individual asset performs in the field, the OEM is sitting on a gold mine of data, ready to be servitized and monetized. The vehicle to deliver those services to the installed base is called – service campaigns.

This article is published on Diginomica.

How do you know you are making money on your service contracts?

In my previous life I sold service contracts for a large OEM. Like many service executives, I was proud of profit margins in the range of 40-60%. But when I talked to my CFO, the numbers didn’t compute in the bigger organisational picture. Let me take you on a narrative of planned versus actual contract profitability and how I gained control over my margin contribution.

Reactive margin contribution

It is still early in the new fiscal year. I have good hopes of making my numbers. Of course I know I have a few ‘high maintenance’ customers. At the same time I have a few ‘cash cow’ service contracts. They will balance out, I’m confident. 

Fast forwarding to the last quarter of the year. Am I still that confident? Obviously I have more insights into my year-to-date cost. Did everything pan out as expected? What options do I have in the remaing weeks of the year to make my numbers?

What I am trying to say. No matter how good my predictions and projections were, actual performance has a tendency to differ from planned performance. Maybe less on aggregate level, but certainly on individual customer or contract level. 

I want to speak the same language as my CFO to better align with the corporate agenda.

It was my ambition to be more in control. Not to depend on reactive and aggregate margin contribution, but to be proactive and predictive on individual customer/ contract level. 

Defining the selling price

When I started selling service contracts I had to brush up my sales 101. How do I define the seling price of my service contracts. I had three paradigms at my disposal.

  • Selling price = Cost plus Margin (aka Cost Plus)
  • Margin = Selling price minus Cost
  • Cost = Selling price minus Margin

If I had full visibility on cost and I had the upper hand in the commercials, then cost plus would work for me. My reality was that cost was more of a guesstimate. Rearding the margin, we had internal margin objectives. But in the commercial arena we often had to give in. This led to the acceptance of the second equation. Margin was not a driver but a result. Margin was reactive. 

Expanding on the narrative in the first paragraph: in the last quarter of the fiscal year the CFO would become vocal using the third equation. If the selling price was an unalterable fact and the margins were falling low, then only available option was to cut my cost.

I want to get ahead of the game to deliver predictable margin contribution.

Influence cost while you can

I went back to my drawing board. How shall I construct my service contracts such that I can monitor all three variables: cost, revenue and margin? In addition I implemented the basic financial concept of planned versus actual and outlook in my service execution process.

After having had my service menucard conversation with my customer, I would cost all those entitlements, resulting in the sum of planned cost. When the contract went into service-delivery mode I would keep a tally on the actual cost. If actual cost develops in a bandwidth of say 10% or planned cost, I knew I would deliver on the expected margin.

Beyond the actual cost development, modern day service execution tools also provide visibility of future service activies. Thus you can create a cost outlook as well. Now you have all the info to make the right decision in real-time, protecting your margins.

Predictive margin contribution

Why all this fuss? Apart from my personal and service domain motivation, my CFO told me loud and clear: I dislike surprises, I want predictability. If only I could cater to the CFO’s wants, maybe I could get access to budget to mature my processes.

I knew I was probably the single largest margin contributor to my companies result. Maybe more out of luck than by design. If only I could invest in tools that would give me that control and predictability.

Better and competitive pricing

Beyond the CFO persona I want to highlight role and importance of the Service-Sales persona. Setting the selling price for a service contract is a subtle process. Price pressure is prevalent in pretty much every sales cycle. The Service-Sales persona needs handles to balance revenue versus margin contribution.

Asset owners want maximum uptime at lowest operational cost.

When my cost insights were on guesstimate level, cost plus did occasionally result in non-competive price points. When my cost guesstimate was too low, my margin took a hit. When I started monitoring the actual margin, I got a good idea if I had priced my service contract ‘fairly’. Deliberately I’ve put the word fairly between quotes. High margins may be good for my bottom line, but from a customer perspective high margins may not be sustainable. Margin insights were an absolute must have for me when renewing/ renegotiating my service contracts.

This article is published on Diginomica and Field Service Digital.

Field service works better when supply chain and service execution work together

An effective supply chain for parts is a crucial part of a successful field service operation. How much time does your technician spend on finding and receiving the correct spare parts? What is the impact to your customers when those parts are not available? What should you do with the defective, left-over and unused parts after the job?

These questions are a compound of conversations I have with customers when doing ride-alongs on service call-outs. They may sound pretty operational, but the implications are significant. Think about higher costs, loss of productivity, unnecessary capital tied up in inventory, repeat visits impacting uptime and customer satisfaction, lost residual material value and negative impact on your circularity goals. There is a lot to be gained from effectively managing your parts. To do this, you need to integrate your supply chain and service execution functions.

Not sold yet? Let’s dig further Into why you should integrate these functions and how it can benefit the business.

Why connect service and supply chain?

In many transformation journeys the initial focus is often on optimising labour to increase the productivity of both the technicians in the field as well as the supporting roles in the front and back office.

But optimisation does not end with labour. There are two very good reasons to accelerate supply chain integration into your service execution:

  1. You need a combination of consumables, spare parts and labour to maintain and fix non-digital products-equipment and assets.
  2. Your CFO will tell you that parts are the second largest cost component after labour.
  3. Having the right parts at the right time and place also optimizes labour productivity.

Though consumables and spare parts are intertwined with the labour component, supply chain integration and optimisation are habitually postponed until phase two of a digital transformation. But even if spare parts costs are second to labour, the implications of not having supply chain integrated into your service execution process are substantial for multiple personas and justify inclusion in phase one.

How does this impact technicians?

In many organisations, supply chain is a separate function with Its own business processes and tooling, resulting in a disconnect with service execution. I’ve seen technicians using email, whatsapp and Excel to order parts and to keep track of forward and reverse logistics. I’ve seen duplicate entry, swivel chair processes and multi-disconnected-tooling. In those situations, the technician works for the tool instead of the tool working for the technician.

If it were up to technicians, having an integration between service execution and supply chain would be high on their wish list. It would make their life easier and would help them in becoming the hero on site.

Can service and supply chain resolve conflicting goals?

From a supply chain perspective there is an ambiguity regarding the necessity for holding inventory. Financially, inventory is tied-up capital, and you want to reduce that. On the other hand, you need inventory to meet contractual response times and uptime commitments.

In contrast, service leaders can easily articulate the need for spare parts. But those same leaders find it difficult to determine how much. Supply chain leaders typically have a year-over-year target to reduce inventory. Sounds conflicting? Maybe not with modern and integrated tooling.

Here’s what have we learnt from the ride-along — if supply chain has access to the ‘raw’ requisitioning, consumption and return data from the technicians, supply chain can do better inventory planning as well as optimise the forward and reverse logistics flows.

In the end you’ll have multiple winners when labour and parts work in unison:

  • Customer — higher first time fix and less downtime.
  • Technician — less admin, track & trace visibility of parts, guidance for returns.
  • Service leader — less parts leakage, higher parts accountability, higher CSAT.
  • Supply chain — insight in true consumption, more leadtime visibility (less expediting).
  • CFO — less purchase of non-consumed parts, lower inventory, less scrap, less logistics cost.

Supply chain and service have many different projects and priorities, but it is in the best interest of your engineers, customers and CFO to integrate your supply chain and service function in the first phase of your digital transformation.

For more on the benefits of connecting service and supply chain, check out What Value Does Asset Data Hold for the Supply Chain?

This article is published on Diginomica.

Will there be an uplift in Depot Repair (vs Onsite Repairs)?

If a product requires a physical repair there are two options: a technician goes to the product or the product comes to the technician. Whatever model is used depends on many different parameters. The good news, with modern service execution tools your options grow exponentially while maintaining control.

Covid is adding an additional boost to the uplift of depot repair. If technicians are not welcome on the site of installation, then the assets, or part of it, have to come to a depot. 

A balanced choice

It would be nice if the repair model could be a choice. A choice based on situational characteristics, instead of rock solid process defaults.

Why choice? Because more vocal and demanding customers expect and request choice. Situational, because the conditions can be different each time to both requestor and provider. By giving choice you provide a level of autonomy to the recipient. Choice is double edged as well. The receiver has to process choice and thus you can get valuable information on what is important to that person. Again, what is important, changes over time and is situational.

Multiple service delivery options

To put field service and depot service in a perspective, I want to paint the wider picture of service delivery options.

Diagram

Description automatically generated

In this picture the cheapest mode of service delivery is the self healing variant. Though cheap from a service delivery point of view, it may be expensive from a product engineering point perspective.

On the other end of the spectrum we have the dual-visit engineer on site variant. If the failure is hard to diagnose, you need a trained engineer to find the problem and define the mitigating action plan. If the spectrum of potential solutions is wide, it is likely you are not carrying all spare parts and tools resulting in a second visit for the fix.

Note: not depicted in the landscape is the NPS/ CSAT element of all these service delivery options. It is in the entitlement process that you weigh the business objectives and select the best option for that service instance.

Design for Service

The various service delivery options are very much tied to the way your products are designed. We all know the example of the owners manual of a car. The manual defines the maintenance guidelines based on a generic use profile. The setup of the service delivery in car dealerships is based on that manual. In short, the simple things are customer replaceable[1], some repairs can be done in the field, whereas others can only be done in a fully equipped depot.

A similar setup applies to the maintenance manual of capital goods. If the capital good itself is non-moveable, then it becomes even more important to design for service. It is unlikely one will deinstall an MRI to send it to a depot. It is also unlikely the technician will carry an unlimited amount of spare parts, tools and calibration equipment. Thus the manual prescribes which ‘nodes’ in the bill-of-material are fixed on-site and which ones will be swapped and sent to a depot.

The rise of depot repair

If technician capacity is scarce. If technician capacity is expensive. If customers want more uptime and faster repairs. Then it is logical that a service organisation moves from lower level component on-site repair to higher level sub-assembly swap. The effort and complexity of repairing the sub-assembly is moved from on-site to depot. As a result you can do more repairs with the same pool of technicians … and even use lesser skilled technicians.

“I used to pay 5$ for a component and 80$ for 1 hour of technician time, now I pay for a 200$ subassembly and 15 minutes of swap time”

And what is the advantage for the asset owner? It is more than only comparing the material and labour cost. You get a faster fix, alias more uptime. The new sub-assembly is fully tested and comes with warranty, alias you get better quality at lower risk. One more benefit. If the sub-assembly swap requires lesser technology skills from the technician, what if the swap could be performed by yourself? This gives you more freedom and flexibility to source those sub-assemblies.

Whether the depot model is charged as part of a full service contract or time-and-material, the value promise presents itself beyond the individual repair action. More-over, the value appraisal will be dependent on the weighing of cost & benefit factors fro both the service organisation and the asset owner.

Enabling and invoking depot repair

To facilitate a depot-model you need business process support that manages :

  • reverse logistics of the sub-assembly from customer to depot
  • facilitates the actual repair/ refurbishment of the unit in the depot
  • triggers forward logistics to get the sub-assembly back to the customer

Depending on your commercial offering, you may want to add additional features like:

  • provide a loaner while sub-assembly is in depot or
  • offer an advance exchange so only one on-site intervention is required and the refurbished unit ends up in inventory.

And maybe most important of all is getting decision-making support when to and when not to invoke of depot repair. This ties to your entitlement process and how you weigh your business objectives when your vocal customer is calling.

With modern service execution tools it’s all about connecting the dots. Using available information from Customer, Workforce and Asset to present choice to both the asset owner and the service provider.


[1] Some of you may be familiar with acronyms FRU & CRU (Field Repairable Unit and Customer Replaceble Unit). If we had to give an acronym to the depot variant, it would be called DRU.

Asset Data Remains Largely Untapped For Driving Revenue Growth

New study finds asset equipment data is key to bridging the gap between sales and service

PLEASANTON, CALIFORNIA – October 19, 2021 – Valuable data collected from servicing equipment assets remains largely untapped, unused and under monetized, offering rich potential to sales and marketing, according to new research conducted by WBRin collaboration with ServiceMax, Inc., a leader in asset-centric, Field Service Management software and Salesforce, the global leader in CRM.

The study, “Building a Bridge Between Sales and Service with Asset Data”, surveyed 100 field service leaders across the US and Canada from a variety of verticals, including manufacturing, information and communications technology, the semiconductor industry and utility sectors.

While all the organizations surveyed currently aggregate and analyze data from their field service operations, only 22 percent trust their field service data completely, indicating lack of confidence in their existing systems or procedures. And more than one-third of respondents can’t connect their field service management solution with their CRM. As a result, organizations are missing opportunities to provide better service to their clients and generate new revenue streams by monetizing data, such as personalizing marketing campaigns, driving more revenue from usage insights and analytics and demonstrating ROI in sales conversations.

While asset data remains largely under-used at present, the study also revealed that almost half of respondents (44 percent) plan to adopt or update their asset data analysis solutions in the next 12 months —including remote and virtual service support tools, asset data analysis solutions, IoT devices and sensors, and others. Likewise, at present, only 27 percent are currently utilizing their field service solutions for field service analytics, while in the next 12 months, 57 percent will deploy this capability.

“The research shows growing recognition and demand for closing the asset data gap,” said Amit Jain, Chief Product Officer for ServiceMax. “This gap exists between an organization’s current service revenue and the maximum revenue it could achieve when every unit sold could have a higher service contract attached to it. By using field data to optimize revenue and drive product innovation, product, service, sales and marketing organizations can maximize their asset performance. This critical insight is relatively new and empowers service leaders to easily shift to outcome-based business strategies that fuel growth in an age where service is now a differentiator.”

The research also found that 43 percent of organizations admit they need to improve their asset uptime and availability, lending further weight to the need for better service data and service delivery.

The full report can be downloaded here.

Salesforce and others are among the trademarks of salesforce.com, inc.

About ServiceMax

ServiceMax’s mission is to help customers keep the world running with asset-centric field service management software. As a recognized leader in this space, ServiceMax’s mobile apps and cloud-based software provide a complete view of assets to field service teams. By optimizing field service operations, customers across all industries can better manage the complexities of service, support faster growth, and run more profitable, outcome-centric businesses. www.servicemax.com

Media Contact:

Nicole Guzzo
nicole.guzzo@servicemax.com

Keeping Your Assets in Shape

Do you have this feeling that the battery of your phone drains faster and faster? Internet forums are full of testimonials and resolutions for keeping your battery in tip-top shape. How does this apply to B2B products, equipment and assets? Can asset owners monitor the performance of the equipment, and what handles do they have to maintain output/ outcome at the nominal level promised at point of sale?

For many years I’ve captured the digital and service transformation journey in a single tagline: “from fixing what breaks to knowing what works.” The message is driven by a simple principle: customers expect things to work. Even more, they expect the outcome of the asset to be stable over the lifecycle.

Another simple truth is that everything eventually deteriorates and breaks. This prompts the following questions:

  • What is the life expectancy of the asset? 
  • What do I need to do to keep the asset in shape?
  • What can I do to extend the life cycle of the asset?

Building a Fitness Plan

Preventive maintenance might be the first thing that comes to mind as the way to keep your assets in shape. But what does preventive maintenance (PM) prevent? And how does it affect asset performance and life expectancy? This was a tough question to answer when one of my counterparts in procurement, who was looking to reduce the selling price of a service contract, asked me, “What will happen when we reduce the PM effort by lengthening the interval?” This was even more difficult to answer when it became a numbers game, and the purchaser asked me to prove the offset between PM and break-fix. 

So where do we look next? I propose condition-based maintenance.  

We know that the performance of an asset will deteriorate over time, and we know the rate of deterioration will depend on various attributes like aging and usage. Because these attributes are measurable, we can use them as levels to trigger a service intervention. 

So rather than taking a one-size-fits-all approach based on time intervals, you can create a custom fitness plan for keeping your assets in shape. One that looks at the condition of the asset in relation to its expected performance. This can look like an intervention being triggered when the output of an asset or the viscosity of a lubricant drops below a certain threshold. 

To continue with the fitness metaphor, we often don’t just want to stay in shape—we also want to increase our longevity and even get in better shape as we age. When it comes to your assets, this is where mid-life upgrades, booster-packs and engineering changes come into play. And in the same way you use predefined levers to trigger service interventions, you should use these levers to trigger updates, upgrades and lifecycle extensions.

Both of these service strategies use asset health at the core of your service delivery model, steering you away from ‘fixing what breaks’ and towards ‘knowing what works.’

A Real Life Example

Imagine you have a pump and valve combination that has a nominal capacity of 140 m3/h.

If you used a preventive maintenance model that runs every 6 months, it would not take into account the age of the pump and valve combination, nor would it account for the corrosiveness of the transported materials. 

But if you took a condition-based approach using IoT-connected sensors, you could measure attributes like vibration, temperature, and energy consumption and use them as indicators for asset performance. For example, if the capacity drops below 130 m3/h, a service intervention would be triggered. It’s like the pump saying: “I’m not feeling well, I need a medicine.” On top of this, if you detect the pump is consistently pushed beyond original specifications, you can know that it’s necessary to initiate an upgrade conversation to safeguard asset health and durability.

Asset Centricity

The common theme of these service strategies is asset centricity. It’s about putting asset health at the core of your service delivery model and continuously comparing an asset’s current output with its expected performance.

By looking at current performance, expected performance and demand, you can also advise your customers on when it’s time to downgrade or upgrade the asset. Through this asset-centric lens you can truly become a fitness coach, advising your customers on the right fitness program that will keep their assets in tip-top shape.Learn more about IoT and condition-based maintenance here.

This article is published in ServiceMax Field Service Digital on September 1st, 2021 and Field Service News on August 25th, 2021.

How to Use Service Marketing to Grow Service Revenue

Over the last five to ten years, a growing number of Chief Service Officers (CSOs) have been assigned a service revenue growth target—a trend recently confirmed through research by Noventum, which found that more than 85% of product manufacturers have set a growth target for their service function. As this trend gains steam, we think it’s worth examining how CSOs can achieve service revenue growth and what they can learn from the sales side.

If you ask a salesperson to grow revenue, they will ask for two prerequisites:

  • More and newer products with more features at a better price point
  • A marketing budget to target the addressable market

What does a CSO ask for when receiving and accepting a service revenue growth target? For many CSO’s, growing service revenue and using service marketing is unchartered territory.

What’s your marketing budget?

Up to 2012, I managed my service operations at Bosch as a cost center. At that time service was the single largest margin contributor to the company. In 2012, I received service revenue growth objectives. Simultaneously my role transitioned from the service domain to the sales domain. In my first conversation with the chief revenue officer, I was asked: “What marketing budget do you need?”

Having run service operations for 25 years, my automatic response was to first focus on achieving excellence for the existing service delivery capabilities. After a crash course in sales and marketing, I revised my strategy. Sell first. Secure the revenue. Use the revenue to finance the maturing of your delivery capabilities.

The result: a quadrupling of service revenue in five years. How? By focusing on two items:

  1. Using the voice of the customer to develop a services portfolio
  2. Setting up service marketing for the installed base

Developing a services portfolio

Back in 2012, I was so focused on service delivery, it never crossed my mind to challenge my services portfolio. My sales colleagues explained to me that a portfolio with sufficient choice is the basis for revenue generation. We then set on a course to create a services portfolio with selectable features and differing price points. Our goal was to create an “a la carte” menu card.

The true test was to come. Would our customers buy the items from our menu card? This is where we realized our need for a true marketing function. A function to help us frame the value messaging and to reach out to the target audience.

Setting up service marketing

First, we looked at the value promise our company made to its customers. Is that value promise pertaining to owning the product and/or is it about using the product throughout its lifecycle? How does our menu card of lifecycle services fit in? And how do we facilitate product owners in making the right service lifecycle choices?

In setting up a marketing function for service, we used our sales colleagues as reference. In the world of sales, key metrics are Total Addressable Market (TAM) and Market Share. Marketing uses these two parameters to spearhead campaigns. In the world of service, these two metrics can be substituted by Installed Base penetration and Attach Rates.

Total addressable market

Suppose you have installed base visibility of 100% and all those units have an attached service contract. Suppose all those contracts are of the type gold-service. The sum of that equation is your maximum achievable service revenue. You could label this as your service-TAM. If your organization also services units of competing brands, the service-TAM will be bigger.

Market share

Your current actual service revenue is the compound result of two factors – your ability to drive installed base visibility and attach rates, in combination with the attractiveness of your services portfolio.

The gap

As mentioned in an earlier blog Mind the Gap, the delta between your service-TAM and your actual market share is your revenue gap. This gap encompasses your target audience for service marketing. The larger the gap, the bigger your compelling reason to review your services portfolio and to establish a service marketing function.

Targeting your audience

Service marketing has one big advantage over sales marketing: with a field service management system focused on asset-centric business models, marketing will have the perfect data set to drive targeted campaigns:

  • Knowing where your installed base is
  • Knowing the state of the asset and how the asset is being used
  • Having a record of the maintenance history
  • Knowing what engineering change orders and modernizations have been implemented
  • Visibility to the current service contract and entitlements

As one of our customers told us:

“We operated a model of sell and forget. Now we sell and service. We have invested in installed base visibility, attach rates, our services portfolio and service marketing. We are now on a deliberate and conscious path of service revenue growth.”

Setting a budget

Knowing what I know now, I would respond differently to my former chief revenue officer. I would request a service marketing budget to revisit my services portfolio and to initiate targeted marketing on my revenue gap.

I would not hesitate to commit to service revenue growth targets, knowing the service delivery organization had an asset-centric field service management system.

This article is published in ServiceMax Field Service Digital on August 25th, 2021