Where are my spares?

Last week the European field service community convened for the first time in large numbers at WBR Field Service in Amsterdam. We had a lot of catching up to do. Apart from topics addressing the next big thing, the down-to-earth conversations had a common theme: where are my spare parts? Covid-19, Ever Given, and geo-political instability are disrupting supply chains. As a result, our service engineers are struggling to keep the world running due to missing parts.

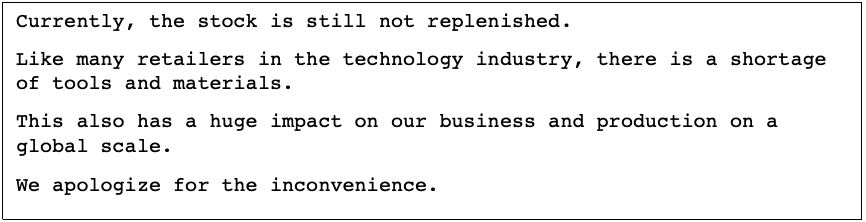
We apologize for the inconvenience

My colleague brought her car for regular service. Due to the unavailability of spares, her car was in repair for five weeks. In the meanwhile, she got a rental. Guess what that costs? Guess what it does to brand and customer experience?

My out-of-warranty high-tech desk lamp showed intermittent behavior ten months ago. Customer support told me that due to a shortage of tools and materials they could not help me other than putting me on hold. After many touch points and mounting emotional pressure, they’ve sent me a new lamp for free. Though relieved I finally have light again, I’m not sure about a repeat purchase.

Last week a heavy truck made an illegal u-turn on an important thoroughfare in our city, overturning multiple traffic lights. Due to supply chain disruptions, repair material is due to arrive in three months. Now the intersection is partially blocked and traffic during rush hour has to be managed by traffic officers. Can you imagine the traffic congestion and productivity hours lost?

Supply disruptions are here to stay

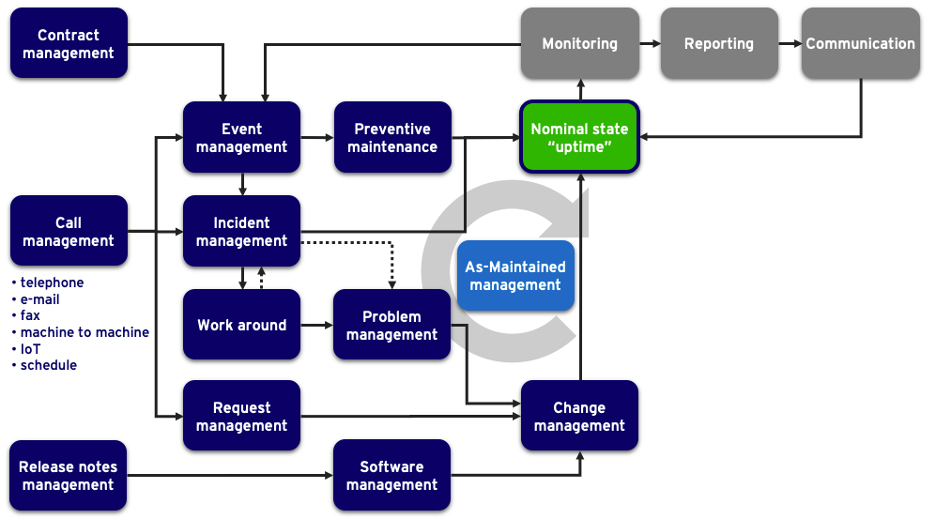
For many years we’ve taken smooth and lean supply chain execution for granted. As a result, most field service initiatives were about optimizing the labor component and deploying smart technology. Recent events trigger a wake-up call. Spares availability is back on the agenda.

For a lot of service organizations, spare parts cost is the second largest cost component after labor cost. With increasing and consistent supply chain disruptions, spare parts availability is becoming distractor number one. This is preventing organizations from keeping their installed base up and running. This is causing organizations to default on SLA and contractual obligations.

Of all the supply chain-related challenges, the two most discussed topics at WBR Amsterdam were:

  • How do we get sufficient parts for our service commitments?
  • And, in case we have a shortage, how do we prioritize parts availability?

Alternative sourcing

Everything that comes out of an asset after a service intervention represents a residual value. That value increases when your normal parts supply gets disrupted.

In my career, I’ve experienced that those reverse materials tend to disappear in a ‘grey circuit’ when not facilitating my technicians with an easy and guided admin for proper reverse routing and handling.

What I formerly saw as a hassle to manage, now becomes a welcome additional source of supply. Apart from solving the sheer availability of parts, the lower cost of refurbished parts allows me to offer differentiated pricing when using parts. I can now choose from new, equal-to-new, certified-spare-part, and used-class. This provides me with both a commercial advantage as well as a cost reduction. I win on multiple axes.

Spread the wealth

Even with an additional source of supply through reverse channels, I still had situations where the demand for parts was larger than the supply. My challenge is how do I spread the wealth of available material over all my demanding customers?

My most extreme situation where supply and demand were out of sync, was when I faced a quality-related recall. Overnight, all existing asset owners would demand a retrofit while my supply chain was restocking on the new revision level. I felt a need to prioritize both internal business objectives and customer entitlements.

Typical supply chain solutions allowed me to deploy first-come-first-serve. Advanced service execution systems enabled me to prioritize based on Account and Service Contract attributes. For example, platinum customers first, or contracts up for renewal in the next 6 months first. Contingent to my business objectives I could spread the wealth and manage the risks of scarcity.

Inconvenience alleviated

Supply chain disruptions and mismatches between supply and demand for spares will continue to cause inconveniences. With modern-day tools, we can alleviate the pain and remove the arbitrariness of scarcity.

It’s a bit like waiting in the queue at a call center. We don’t like waiting, but at least we have visibility on the queue. And if that is too long, we can upgrade our service level to get the benefits of a priority queue.

Learn about ServiceMax’s solutions for spare parts, returns and depot repair management:

Continue reading about spare parts planning and supply chain disruption:

This article is published on Field Service Digital.

How do you know you are making money on your service contracts?

In my previous life I sold service contracts for a large OEM. Like many service executives, I was proud of profit margins in the range of 40-60%. But when I talked to my CFO, the numbers didn’t compute in the bigger organisational picture. Let me take you on a narrative of planned versus actual contract profitability and how I gained control over my margin contribution.

Reactive margin contribution

It is still early in the new fiscal year. I have good hopes of making my numbers. Of course I know I have a few ‘high maintenance’ customers. At the same time I have a few ‘cash cow’ service contracts. They will balance out, I’m confident. 

Fast forwarding to the last quarter of the year. Am I still that confident? Obviously I have more insights into my year-to-date cost. Did everything pan out as expected? What options do I have in the remaing weeks of the year to make my numbers?

What I am trying to say. No matter how good my predictions and projections were, actual performance has a tendency to differ from planned performance. Maybe less on aggregate level, but certainly on individual customer or contract level. 

I want to speak the same language as my CFO to better align with the corporate agenda.

It was my ambition to be more in control. Not to depend on reactive and aggregate margin contribution, but to be proactive and predictive on individual customer/ contract level. 

Defining the selling price

When I started selling service contracts I had to brush up my sales 101. How do I define the seling price of my service contracts. I had three paradigms at my disposal.

  • Selling price = Cost plus Margin (aka Cost Plus)
  • Margin = Selling price minus Cost
  • Cost = Selling price minus Margin

If I had full visibility on cost and I had the upper hand in the commercials, then cost plus would work for me. My reality was that cost was more of a guesstimate. Rearding the margin, we had internal margin objectives. But in the commercial arena we often had to give in. This led to the acceptance of the second equation. Margin was not a driver but a result. Margin was reactive. 

Expanding on the narrative in the first paragraph: in the last quarter of the fiscal year the CFO would become vocal using the third equation. If the selling price was an unalterable fact and the margins were falling low, then only available option was to cut my cost.

I want to get ahead of the game to deliver predictable margin contribution.

Influence cost while you can

I went back to my drawing board. How shall I construct my service contracts such that I can monitor all three variables: cost, revenue and margin? In addition I implemented the basic financial concept of planned versus actual and outlook in my service execution process.

After having had my service menucard conversation with my customer, I would cost all those entitlements, resulting in the sum of planned cost. When the contract went into service-delivery mode I would keep a tally on the actual cost. If actual cost develops in a bandwidth of say 10% or planned cost, I knew I would deliver on the expected margin.

Beyond the actual cost development, modern day service execution tools also provide visibility of future service activies. Thus you can create a cost outlook as well. Now you have all the info to make the right decision in real-time, protecting your margins.

Predictive margin contribution

Why all this fuss? Apart from my personal and service domain motivation, my CFO told me loud and clear: I dislike surprises, I want predictability. If only I could cater to the CFO’s wants, maybe I could get access to budget to mature my processes.

I knew I was probably the single largest margin contributor to my companies result. Maybe more out of luck than by design. If only I could invest in tools that would give me that control and predictability.

Better and competitive pricing

Beyond the CFO persona I want to highlight role and importance of the Service-Sales persona. Setting the selling price for a service contract is a subtle process. Price pressure is prevalent in pretty much every sales cycle. The Service-Sales persona needs handles to balance revenue versus margin contribution.

Asset owners want maximum uptime at lowest operational cost.

When my cost insights were on guesstimate level, cost plus did occasionally result in non-competive price points. When my cost guesstimate was too low, my margin took a hit. When I started monitoring the actual margin, I got a good idea if I had priced my service contract ‘fairly’. Deliberately I’ve put the word fairly between quotes. High margins may be good for my bottom line, but from a customer perspective high margins may not be sustainable. Margin insights were an absolute must have for me when renewing/ renegotiating my service contracts.

This article is published on Diginomica and Field Service Digital.

Is the Service Menu Card Replacing Bronze, Silver and Gold Contracts?

During last week’s High Tech Manufacturing event in the Netherlands, we reimagined tomorrow’s service delivery in the context of vocal and demanding customers. If customers expect products to work, is it enough to mitigate downtime, or should you know why your products work and in the context of customer usage? Is your current services portfolio in line with tomorrow’s customer expectations?

Bronze, Silver & Gold Contracts

In reviewing the services portfolio I used words like bronze, silver, and gold contracts to paint a continuum of reactive to proactive and predictive contracts. In an earlier blog on Mind the Gap, I used gold to quantify your maximum services revenue.

Proverbially the gold contract is the ultimate bundle of services to guarantee the uptime of the equipment. It’s not really product-as-a-service, as the customer still needs to buy both the product and a service contract, but outcome-wise it is the next best thing.

Just like with any product or service that is sold today, B2B or B2C, the big question is: who decides what is put into the bundle? Is it a seller-push or a buyer-pull?

This is exactly the challenge the high-tech manufactures are facing today. Based on our discussions during the event, the consensus was: we need to provide more choice and autonomy to our customers. Even if the installed product is the same, the usage context is different case by case.

Product Push vs. Usage Pull

It is not uncommon that the current bronze, silver, and gold bundles are based on product characteristics. When we sell expensive and/or complex products, we tend to believe we need to offer the higher segment of bundles. But if your expensive product is used in lower utilization environments, then the cost of downtime to its owner is lower, resulting in less budget for mitigating strategies. That unit may end up with a bronze contract.

If we want to address the challenge of more vocal and demanding customers, we need to flip the bundling paradigm from product to usage characteristics. To understand those usage characteristics we need to have a mitigating strategy conversation with the owner/user of the product.

Mitigating Strategy Conversation

Dear buyer, why is my product so important to you, and what happens if my product fails? What impact does downtime have on your operations?

If your customer is buying your product, meaning there is a point of title passage, it implies that all risks associated with owning the product reside with your customer. As a product owner, your customer will define a mitigating strategy for uptime/downtime risks throughout the life cycle of the product. As OEM you can help the product owner by offering life cycle services. The owner will weigh risk versus price.

Dear buyer, do you agree with me that throughout the life cycle of the product you will need the following service activities to maintain and safeguard the uptime of the product? Which of those activities do you want to execute yourself and which ones do you want me to do?

Is the Service Menu Card is Replacing Bronze, Silver and Gold Contracts?

The above picture a derived from the ITIL v4 framework by Axelos. All boxes serve the nominal state of the product, the uptime. And uptime ensures the output and outcome of the product. If your customer agrees with this landscape of services, the conversation becomes a simple one: what level of risk does the owner/buyer want to retain, versus outsourcing that risk to a service provider in exchange for a fee.

Driving Business Results with Entitlement Process

Flipping the service bundle paradigm and handing over the choice to your customer may sound scary. Is it controllable? With modern-day field service management software the answer is yes. It’s similar to going to a restaurant. You define what is on the menu. Your customer has the choice. And any good chef knows that the personal interaction at the table when ordering is key to the choices made. The success of CSAT starts when ordering.

With modern tools, you can implement a service menu card in the service-sales process. The true value comes from pairing the menu card with an entitlement engine in your service delivery process. It’s great that you sold all those configure-to-order service contracts to meet customer requirements. The people that have to deliver the services need to be aware of what has been promised, what has been paid for, and what is billable. This is where the entitlement engine kicks in.

A sophisticated entitlement engine has visibility on the customer, the asset, the contractual obligations agreements, and on the specifics of the customer-ask as specified in the case or work order. As ‘gatekeeper’ the entitlement engine will drive:

  • Customer expectation & satisfaction
  • Leakage reduction
  • Cross & Upsell increase
Is the Service Menu Card is Replacing Bronze, Silver and Gold Contracts?

To accommodate vocal and demanding customers a service menu card is a good alternative to bronze, silver, and gold bundles. Having choice and autonomy creates engagement and builds the foundation to success and CSAT.

To stay in the restaurant analogy, the proof is in eating the pudding. Your service delivery organization needs to have insight into what has been sold/ promised and be able to act on it. Imagine the waiter bringing the food without knowing the order. No tip, invoice at risk, no return visit.

The service menu card and the entitlement engine go hand-in-hand. Say what you do then do what you say.

Learn more about service contracts & entitlements from ServiceMax here. 

This article is published in ServiceMax Field Service Digital on October 21st, 2021

How to Use Service Marketing to Grow Service Revenue

Over the last five to ten years, a growing number of Chief Service Officers (CSOs) have been assigned a service revenue growth target—a trend recently confirmed through research by Noventum, which found that more than 85% of product manufacturers have set a growth target for their service function. As this trend gains steam, we think it’s worth examining how CSOs can achieve service revenue growth and what they can learn from the sales side.

If you ask a salesperson to grow revenue, they will ask for two prerequisites:

  • More and newer products with more features at a better price point
  • A marketing budget to target the addressable market

What does a CSO ask for when receiving and accepting a service revenue growth target? For many CSO’s, growing service revenue and using service marketing is unchartered territory.

What’s your marketing budget?

Up to 2012, I managed my service operations at Bosch as a cost center. At that time service was the single largest margin contributor to the company. In 2012, I received service revenue growth objectives. Simultaneously my role transitioned from the service domain to the sales domain. In my first conversation with the chief revenue officer, I was asked: “What marketing budget do you need?”

Having run service operations for 25 years, my automatic response was to first focus on achieving excellence for the existing service delivery capabilities. After a crash course in sales and marketing, I revised my strategy. Sell first. Secure the revenue. Use the revenue to finance the maturing of your delivery capabilities.

The result: a quadrupling of service revenue in five years. How? By focusing on two items:

  1. Using the voice of the customer to develop a services portfolio
  2. Setting up service marketing for the installed base

Developing a services portfolio

Back in 2012, I was so focused on service delivery, it never crossed my mind to challenge my services portfolio. My sales colleagues explained to me that a portfolio with sufficient choice is the basis for revenue generation. We then set on a course to create a services portfolio with selectable features and differing price points. Our goal was to create an “a la carte” menu card.

The true test was to come. Would our customers buy the items from our menu card? This is where we realized our need for a true marketing function. A function to help us frame the value messaging and to reach out to the target audience.

Setting up service marketing

First, we looked at the value promise our company made to its customers. Is that value promise pertaining to owning the product and/or is it about using the product throughout its lifecycle? How does our menu card of lifecycle services fit in? And how do we facilitate product owners in making the right service lifecycle choices?

In setting up a marketing function for service, we used our sales colleagues as reference. In the world of sales, key metrics are Total Addressable Market (TAM) and Market Share. Marketing uses these two parameters to spearhead campaigns. In the world of service, these two metrics can be substituted by Installed Base penetration and Attach Rates.

Total addressable market

Suppose you have installed base visibility of 100% and all those units have an attached service contract. Suppose all those contracts are of the type gold-service. The sum of that equation is your maximum achievable service revenue. You could label this as your service-TAM. If your organization also services units of competing brands, the service-TAM will be bigger.

Market share

Your current actual service revenue is the compound result of two factors – your ability to drive installed base visibility and attach rates, in combination with the attractiveness of your services portfolio.

The gap

As mentioned in an earlier blog Mind the Gap, the delta between your service-TAM and your actual market share is your revenue gap. This gap encompasses your target audience for service marketing. The larger the gap, the bigger your compelling reason to review your services portfolio and to establish a service marketing function.

Targeting your audience

Service marketing has one big advantage over sales marketing: with a field service management system focused on asset-centric business models, marketing will have the perfect data set to drive targeted campaigns:

  • Knowing where your installed base is
  • Knowing the state of the asset and how the asset is being used
  • Having a record of the maintenance history
  • Knowing what engineering change orders and modernizations have been implemented
  • Visibility to the current service contract and entitlements

As one of our customers told us:

“We operated a model of sell and forget. Now we sell and service. We have invested in installed base visibility, attach rates, our services portfolio and service marketing. We are now on a deliberate and conscious path of service revenue growth.”

Setting a budget

Knowing what I know now, I would respond differently to my former chief revenue officer. I would request a service marketing budget to revisit my services portfolio and to initiate targeted marketing on my revenue gap.

I would not hesitate to commit to service revenue growth targets, knowing the service delivery organization had an asset-centric field service management system.

This article is published in ServiceMax Field Service Digital on August 25th, 2021

Using trigger points to manage your service business

Sometimes it feels like being a jack of all trades when managing a service business. On the one hand you act like a firefighter, on the other hand you know service is strategic to your business’s future earnings. That said, how do you elevate your job from the reactive to the proactive? Establishing trigger points may be the key ingredient to manage your business on an 80/20 basis. Thus, giving you the focus on interventions that matter.

Define success

When do you know you are doing a great job? In speaking to many service executives, it is not always clear what the norm is. “We want to increase service revenue by 20%”. Why 20%? Why not more? Why not less? In my blog Mind the Gap I tried to establish a norm for a maximum service revenue. In a blog by Shawn LaRocco he defined a norm for Cost to Serve. Both blogs have in common that success is put in a perspective of a norm.

Triggering the outliers

A facilities management customer of ours is processing 15,000 – 20,000 workorders per month. In the past they had a team of 30+ people in the back office validating and correcting all debriefed work orders. Based on gut feeling and experience there was a belief that 80% of the work orders did close within a bandwidth of ±5% of expectation. By formalising that bandwidth through trigger points, they now have a tool to filter the volume and start managing by exception.

Timely intervention

Apart from managing your workload on a 80/20 basis, trigger points serve as an early-warning system allowing for timely intervention. You don’t want to pay penalty cost for a missed SLA. Instead, you want a service job to be flagged if its progress jeopardises SLA attainment. E.g., a break-fix job needs to be completed within 4 hours. After 3 hours you could ping the technician to ask if completion is still on track. If not, you could provide the technician with support and/or contact the customer with a heads up.

A trigger point is thus a floor or ceiling boundary on a metric triggering an event. Using workflow, you can route the event to the mitigating personas in your organisation.

Value = Result minus Expectation

Many years ago, the value of trigger points was eloquently explained to me by university professor Meindert Flikkema. He stated that every event has both an expectation and a result. If somebody gets more than expected, then that person is happy … and vice versa.

In the context of running my own service organisation at Bosch I tweaked Meindert’s equation and added the concept of a bandwidth around expectation. Similar to the above example of ±5%, I strived to manage my operations inside the bandwidth. Inside the bandwidth I let the business run on automations. If I managed well, that would account for 80% of my workload. The outliers I routed to my attention queue. Over time trigger points would help me focus on what really matters for both my customers and my CFO. I’ll use the business driver contract profitability to illustrate the value equation and its impact.

Contract profitability in action

Suppose a customer wants to buy a full-service contract with a scope-of-work containing preventive maintenance, capped break-fix events, calibrations, software maintenance and an included set of spare parts and consumables. Using a CPQ-like tool the scope-of-work totals to a calculated cost of $75,000, a calculated revenue of $100,000 and an expected margin of 25%.

Throughout the lifecycle of the contract executed service activities will impact the cost you accrue. If those cost exceed the $75,000 you have either over-delivered or over-run on your calculated cost. Your CFO will see a less-than-expected margin contribution. If your margin is significantly more than the expected 25%, then either you are over-charging or under-delivering. Your customer may get a feeling he/she is not getting value for money. 

Tipping the trigger level should make you curious. Challenge both expectation and result. Do you have a clear understanding of cost-to-serve? Are you taking the life cycle of the product into account? Did the product owner accept your mid-life-upgrade proposal?

Pro-active

As service leader you don’t want to be told about under or over-situations by your CFO when it is too late for corrective intervention. Similarly, you don’t want you customers to churn. Trigger levels act as an early-warning system before you accrue irreversible cost or impact customer expectation negatively.

  • It’s November. Show me all contracts at 80% of calculated cost. Let’s see what service activities we can push out to ‘save’ this years’ margin contribution.
  • It’s July. We anticipated six break-fix events for a full year. We’ve already had four. We want to flag future break-fix service requests to inform the customer service agent and technician to be stricter.
  • It’s September. The year-to-date contract margin spikes at 35%. Upon investigation you find that a contracted and scheduled calibration activity has been cancelled by the customer. Instead of treating this as easy money, you engage with your customer to pre-empt contract renewal conversations.

Managing intelligent

As long as we have unplanned downtime, firefighting will remain an element of a service leaders’ job. Service execution tools are a great help to facilitate the transaction and collect service data. The true value manifests itself when you use transactional data in combination with trigger levels. Trigger levels give you that early-warning to become pro-active instead of reactive. Trigger levels add direction to your decision making. And better decision making makes you more intelligent and more strategic. Not only inside the service domain, but across your organisation.

This article is published in ServiceMax Field Service Digital on July 27th, 2021

Finding Revenue Leakage in your Service Business – part 2

Do you know what your maximum service revenue potential could be based on the product units your organisation sells? Is your current service revenue less than this maximum? And, do you have a process to upsell service contracts into your existing installed base? One or more puzzled looks, chances are big you are suffering from Upsell-leakage. 

In the previous episode we have defined two types of leakage; Contract and Non-Contract leakage. In this episode we’ll define Upsell-leakage. Most likely upsell leakage will be twice as big as the other two combined.

Upsell leakage

As service organisation you’d like all your customers to buy your premium service. Some customers will buy ‘gold’ service level for their installed base, others will be happy with ‘basic’ service. It all depends on the use case of your customer and their propensity to value the services you offer. As use cases tend to change over time, you may want to consider setting up an upselling program using the touch points from your service delivery. 

If you don’t ask, you don’t give them the opportunity to say yes

Not having such a programme deprives you of revenue potential; being the delta between your current service revenue and ’gold’ service level.

Defining the upsell service revenue potential

To quantify upsell leakage we can use a mechanism known to Sales as TAM (Total Addressable Market). Suppose you sold 1,000 units at $10,000 each. Suppose a ‘gold’ service contract has an annual selling price of 12% of the unit selling price. This would put your service-TAM at $1,200,000 per annum.

Imagine your service department has 600 of those 1,000 units on their radar screen. The rest is sold via an indirect sales channel and/ or lost-out-of-sight. This gives an installed base visibility of 60%. Let’s assume those 600 units generate a service revenue of $400,000, split across:

  • 10% of units are in (OEM) warranty and don’t generate revenue (yet)
  • 50% of units have a bronze, silver or gold contract generating $240,000
  • 40% of units don’t have a contract and generate $160,000 in Time & Material (T&M)

With the above figures you currently reap 33% of your service-TAM and you have an upsell potential of $800,000. Monitoring this upsell leakage metric should give you the incentive to put a revenue generation program in place.

Metrics driving upsell leakage

In the numeric example we’ve touched on three metrics that impact and drive upsell leakage.

  • Installed base visibility: it all begins with installed base visibility. Units not on your radar screen will not contribute to your service revenue! This is easier to manage for units sold via your organisation’s direct sales channel, though it does require an effort to manage the life cycle from as-sold to as-maintained. For units sold via the indirect sales channel you’ll have to exert extra effort to get access point-of-sale data, maybe even ‘buying’ the data.
  • Attach rates: both warranty and contracts are attached to the unit, thus driving attach rates. Attach rates are ‘boolean’, they say something about having an attached contract, not about the amount of revenue you get through that contract. Attach rates start at the installation/ commissioning date of a unit. Either Sales makes the attached-sale at point-of-sale of the unit or the Service department drives the attaching post-point-of-sale. Driving metric for Service is to maintain a continuum of attachment throughout the life cycle of the unit. 
  • Service revenue contribution: Within the subset of attached contracts you’d like to have as much revenue contribution as possible, ‘gold’ service being the holy grail. Per service contract you could have any of the following revenue contributions:
    • OEM Warranty: 0% of Service-TAM
    • Enhanced Warranty: 33% of Service-TAM (only the on-top-of OEM warranty piece)
    • Extended Warranty or Basic service: 67% of Service-TAM
    • Gold: 100% of Service-TAM

In terms of merchandise, you can’t force anyone to buy something

Remedying upsell leakage

The overarching paradigm to growing service revenue is twofold: increasing your installed base visibility and making sure you have attached offerings to those units. 

Getting visibility on units sold via the indirect channel is slightly more complicated, but once you quantify the associated service-TAM with those units, you may have the ‘funding’ to ‘buy’ the data. This may even lead to revenue sharing models with your channel partners.

The last piece of the puzzle is using the visibility of the upsell leakage gap whenever you have a touch point with your customer. Note that the original (service) contract has been drafted many months ago by people whom are further away from the business, who could not 100% envision the service reality of today. You thus may end up in an entitlement conversation where the customer has an urgent requirement whereas the contract ‘only’ covers for the ‘basics’. The delta is an upsell opportunity. Either resulting in an upgrade of the service contract or maybe only upgrading an incidental work order. In case the latter happens more often, you have the data points to convince the customer for the former.

Now, understanding that upsell leakage is potentially twice as big as contract and non-contract leakage together, you may have found your compelling reason to start another revenue growth project.

This article is published in ServiceMax Field Service Digital on November 19th, 2020 and Field Service News on Jun1 1st, 2021

Finding Revenue Leakage in your Service Business – part 1

Have you ever had to Credit or Discount an invoice? If the answer is ‘yes’ then you have leakage, if the answer is ‘no’ then you definitely have leakage.

How do you respond to the Aberdeen finding that best-in-class companies have a whopping 14% warranty & contract leakage? Denial, absurd, overstated, or … wait-a-minute, maybe I’m not looking at the right KPIs to detect leakage. Once you acknowledge leakage exists in your organisation, wouldn’t you go all the way to manage leakage out of your business, knowing it has a direct impact on your bottom line?

Defining leakage

What is service leakage? In the simplest terminology: you are losing money. And the bad news is that it often happens without you knowing or realising it.

We can distinguish two types of service leakage:

  1. Non-Contract leakage : the periods in the operational life cycle of an asset not covered by warranty and/or a service contract (sometimes this is also called T&M-leakage because service outside a contract classifies as T&M).
  2. Contract leakage: an asset is covered by warranty and/ or a service contract but in your service delivery you provide more and/or a higher level of service than the customer is entitled to. 

Contract leakage typically occurs when service organisations do not know and/or manage expiration dates of warranty and contracts. Non-contract leakage typically occurs when the entitlement process is fragmented and/ or when the information is not accessible to all involved service actors.

Let’s mention a couple of common scenarios:

  • A customer claims a defect within the warranty period. You correctly entitle the job as ‘warranty’. On site the technician detects ‘customer induced damage’. The technician performs the repair anyhow and there is no charge to the customer.
  • A customer is entitled to next day service but presses you to fix the machine today without paying an additional fee. Because your technicians are not busy today, you give in to the request.
  • A customer makes a service request assuming the current contract is still active. Upon entitlement check you detect it has expired three months ago. The customer agrees to renew the contract per current date. You incur 3 months loss in contract revenue.
  • A customer has multiple machines of the same model. Only one of them is covered by a contract. The single contract line is used to entitle work on all of them because the customer always uses the same serial number.

Service Leaks are not the problem; they are the symptom. They reveal a disconnect between process design and actual behaviour. Denial of leakage increases the disconnect.

Impact of leakage

One of the unfortunate things in business is that the cost always hits you – now, if you are so good at capturing cost why do you allow revenue to slip through your fingers? How do you think your shareholders would enjoy hearing that you worked on a customer’s asset and neglected to bill them? 

Another way to look at the impact of leakage is to establish how much extra revenue would need to found above and beyond what you are already billing for. Let me paint a picture for you, as we have established you capture all of your costs so any leakage (missed revenue) that you capture will have a 100% positive impact to your bottom line – every dollar billed will be a full dollar of equivalent gross margin. So, let’s say you were running at 20% margin as a service organisation and you allowed $100,000 to leak through your service organisation, now a service org would need to go and find $500,000 of brand spanking new business to offset this $100,000 leakage just to break even. How hard is it for a business to find $500,000 of extra revenue with the same resources? 

Actually, quite easy – set your system up to minimise the risk of leakage….

On top of the cost, revenue and margin contribution impacts, customer expectation is a big one. Leakage has a very large behavioural component. If a customer is used to getting service for free, it becomes very difficult to start charging for it. If a customer ‘discovers’ you can’t manage your entitlements correctly, this may lead to ‘unwanted’ service calls.

A similar behavioural impact can be expected on the technician’s end. A technician chose his job because he/she wants to fix things and be a hero on site. A technician did not select the job to do admin and become a contract-referee. Thus, if you do not empower your technicians with the right tools and information, do not expect any cost/revenue sensitivity, they will go for CSAT and please the customer.

Finding leakage

Do you find leakage or is it a matter of ‘capturing’ it? You are delivering all of the services that create the opportunity for leakage, so you already know where it is, you just need the correct tools to capture it, Oh and by the way,  they are never humans and excel… You need a robust process and a software solution to support that process and remove ‘chance’ from the equation. 

Detecting, quantifying and finding the origin of leakage in your organisation is a process like remedying a leaky roof. You’ll need adjacent ‘instruments’ to find the source.

Remedying leakage

The first step towards remedying leakage is accepting its existence. Once you have made leakage visible, you can start actioning it. And in general those actions fall into three categories:

  1. Stop delivering free service; this has a direct cost reduction benefit.
  2. Continue delivering ‘free’ service and start charging for it; this will increase both your revenue and your margin; the additional margin is 100% as we have shown you have already incurred the cost.
  3. Continue delivering ‘free’ service and use it as collateral for something else of value; this benefit is harder to manage, but we can argue it is good for CSAT and can be used during contract renewal to counter cost & rate reduction arguments from your customer.

This article is published in ServiceMax Field Service Digital on November 10th, 2020

Mit Servicevertragspartnern ein konsistentes Kundenerlebnis sichern

Beim Aufbau und der Umgestaltung einer Serviceorganisation wird unweigerlich das Thema des Umgangs mit externen Dienstleistern und Partnern (Contractors) zur Sprache kommen. Ob es nun darum geht, zu skalieren, flexibler zu werden oder die Kosten zu senken – die meisten Diskussionen drehen sich um das „Wie“. Wie können wir eine Vielzahl potenzieller Partner verwalten und gleichzeitig die Kontrolle über Kunden und deren Erfahrungen behalten? Und was können wir tun, um die Chancen einer Zusammenarbeit zu maximieren und die Risiken zu minimieren?

Konfigurierbares Ökosystem

Um das richtige Gleichgewicht zu finden, definieren wir in der Regel zunächst Begriffe wie Outsourcing / Insourcing und (Sub-) Auftragnehmer / Partner. Je nachdem, ob Sie ein OEM (Original Equipment Manufacturer), ein Third Party Maintainer (TPM), ein Anlagenbetreiber oder ein Facility Manager (FM) sind, ergeben sich unterschiedliche Auswirkungen.

Wenn Sie also Vertragspartner zu Ihrem Ökosystem hinzufügen möchten, müssen Sie die Regeln für die Einbeziehung klar festlegen und diese mit unterstützenden Tools und Prozessen festigen. Diese Regeln können an Bedingungen geknüpft sein, die je nach Region, Produktgruppe, Art des Auftrags usw. variieren.

Partner einstufen

Ähnlich wie bei der Beziehung zu Ihren Lieferanten werden Sie wahrscheinlich ein unterschiedliches Maß an „Nähe“ zu Service-Vertragspartnern haben. Diese Beziehung ist definiert durch die Verfügbarkeit von Partnern und deren Wettbewerbsposition gegenüber Ihrem Endkunden.

Zudem bieten Servicepartner heute die Flexibilität, verschiedene Servicemodelle umzusetzen: 
Partner

  • verwenden Werkzeuge und Prozesse von einem OEM
  • bringen ihre eigenen Geräte in die Prozesse des OEM ein
  • verwenden ihre eigenen Tools und Prozesse – Arbeitsaufträge werden als Blackbox eingeplant
  • verwenden ihre eigenen Tools und Prozesse – Aufträge werden mit vollständiger Transparenz eingeplant

Diese Flexibilität erlaubt Ihnen, Ihre Partner gezielt so einzusetzen, dass Sie mehr Kunden besser bedienen können.

Kundenerlebnis messen

Sie haben nun mehr Flexibilität, Servicepartner zu nutzen, wie können Sie dennoch das Kundenerlebnis steuern? Einige unserer Kunden wünschen eine konsistente Servicebereitstellung, ohne dass der Endkunde weiß, ob der Service von ihrer Organisation oder von einem Partner erbracht wird. Andere Kunden möchten die Unterschiede zwischen den Serviceleistern hervorheben und dies als Wettbewerbsvorteil nutzen.

Um erfolgreich das Kundenerlebnis zu messen, müssen eine höhere Sichtbarkeit geschaffen, die Performance der Serviceleistungen gemessen und einheitliche KPIs für alle Serviceerbringungen definiert werden. Wenn Sie Daten gemeinsam nutzen, ohne über deren Interpretation „verhandeln“ zu müssen, können Sie Ihre Geschäftsziele an den Geschäftszielen Ihrer Servicepartner ausrichten. Infolgedessen gewinnen Sie, Ihr Contractor gewinnt und Ihr Endkunde gewinnt.

Partner messen

Abgesehen von strategischen, kaufmännischen und technischen Aspekten ist die Steuerung eines Servicepartners wie die Steuerung der Serviceerbringung. Bis zu einem gewissen Grad sollten Sie die Arbeit externer Ressourcen auf ähnliche Weise messen wie die Arbeit Ihrer internen Mitarbeiter. Ihr Endkunde soll das erhalten, worauf er Anspruch hat, gleichzeitig möchten Sie eine angemessene Marge erzielen.

Da Servicevertragspartner zu marktüblichen Konditionen arbeiten, sollten Sie sich auf die folgenden drei Messgrößen konzentrieren, da diese die Kundenerfahrung, die Serviceerbringung und die Leistung der Auftragnehmer am unmittelbarsten beeinflussen:

  • First-Time Fix: Ist die Servicequalität gut, wurde das Problem sofort behoben?
  • Mittlere Reparaturzeit: Wie lange dauert es, bis das System wieder verfügbar ist? 
  • Net Promoter Score: Ist der Endkunde mit dem Service zufrieden?