Should I Buy An Asset-Centric Solution or Build It?

Co-author: Katharina Streater 

It takes twice as long, at twice the cost and you will only get half of the expected functionality.” Many times, we have heard this proverbial phrase. And even if it is true, does it automatically mean you will go for the buy-variant? We’ve learned that decision-making consists of weighing many pros and cons. In this blog, we’ll provide you with a set of arguments to take into consideration.

More than just the financials (The Mindset Matters)

In our experience, a build-versus-buy decision is both multi-faceted and multi-stakeholder. To give you an example: A business leader will typically look for business process support and time to value. An IT leader may have a preference to stay on the same platform and exert control through the deployment of internal IT resources. Procurement will weigh the risk profile and continuity of the vendor base. The security officer may focus on secure, compliant transfer and storage of the business data. And finance? From finance, we expect that they will compare the cost of build versus buy in relation to the budgeting cycle.

What you have here is a mix of different personas, each with different priorities and objectives. So, how to tackle this, how to move forward? You can start to untangle this Gordian knot by genuinely trying to understand and acknowledge each stakeholder’s position.

One word of caution. However accurate the numbers are that you come up with. As you are zooming in on the pros and cons with the goal of creating a viable comparison, you need to do your homework and not only gather the facts but also be aware that each stakeholder has a different motivation.

As a business leader from Bosch said so eloquently:

“I don’t care about the make and model of the tool. I’ve got a business to run” – business leader at Bosch

We started this blog by outlining the various personas that each have their own priorities, but at the end of the day, there is one common goal: keeping the business running—today and tomorrow. And to do this, you need a solution that can either be built or bought.

What are the hidden and obvious costs?

Let’s start with the most rational comparison: the financial axis. For sure the first and foremost thing finance wants to do is compare the cost of build versus buy. The purchasing cost is easy to identify. It’s the figure at the bottom of the vendor’s quotation. What is on the build side of the equation is more elusive. If building software is not your core business, it is difficult to grasp what effort goes into creating and maintaining a business application. When we see stakeholders evaluating the financials of build versus buy, typically only a fraction of the build costs turn up in the comparison. The reputed tip of the iceberg.

Together with a number of prospects, we created a model to help identify and uncover how far the iceberg extends under the waterline, in other words—to make the hidden cost elements visible. While building the model, we had to face difficult questions such as:

  • How much effort does it take to retrieve the data points?
  • Is it even possible to obtain an insight into the below-sea-level items?
  • To what extent will a complete view of the build cost influence the decision-making?

In close collaboration, we discovered two findings:

  1. Apart from any numeric comparison, getting a complete picture of all cost elements proved to be extremely insightful and changed how both scenarios are evaluated.
  2. Appraising the ‘submerged’ cost elements is essential in defining the tipping point.

Evaluating build versus buy

When making a build-versus-buy decision business leaders strive to get a complete picture of the cost aspects and understand the impact on the business as a whole. But how do they know that? This is where the iceberg comes into play.

When working with prospects and customers to uncover the true cost for them, we found the iceberg to be an educational exercise and a great conversational framework to understand all aspects of business application creation and usage. Different areas in the framework have different owners and they don’t all have the same agenda, e.g. the cost for software developers falls within the IT department, whereas cloud-subscription fees come out of the line of business budget.

Our framework requires input from all areas that DIY touches on. By doing so, it also reveals the mindset and priorities of the different stakeholders and provides insight into the evaluation criteria of the build-versus-buy decision. As such it will be an eye-opener and helps to align all stakeholders.

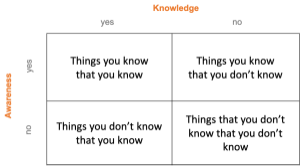
Conscious Competence Learning Matrix

‘Hidden’ costs impact the tipping point

The hidden or underwater costs play a significant role in determining the tipping point. It’s a matter of simple mathematics. The more you can exclude hidden costs from the equation, the more your decision will lean towards build. This conclusion led us to investigate why one would exclude hidden costs. We found:

  • The effort to retrieve the hidden cost is too high.

What to do about it: This is fairly easy to mitigate. To find your way out of this impasse, think about using estimates and guesstimates as an alternative to actuals. As long as your data is ‘good enough’, you can still use it to make good decisions. Thus, not creating an exact cost comparison, but a probable comparison.

  • We don’t want to include hidden costs.

What to do about it: This finding is more of a political and commercial nature. Here it matters who you are talking to. You can imagine that a sales rep who is trying to sell the buy-scenario has an avid interest in having as many costs associated with the build-scenario and vice versa. To overcome this potential conflict of interest, we co-developed the cost comparison model. As a result, we know that all cost elements in the model are relevant to the decision-making. When we encounter a persona saying that a particular cost element is non-retrievable, we have solid arguments to go into challenger mode.

A blend of arguments

We started this blog by explaining that a build-versus-buy decision spans multiple departments and stakeholders, and we gave the financial aspect the most weight when it comes to making the choice. There are certainly other factors that play a role in the decision, such as time to value, feature richness and risk, but ultimately, all of these aspects affect the total cost to build.

For several of our prospects, the co-developed framework has been instrumental in finding an answer when faced with the question Do I Build or Do I Buy?

build costs

If you want to find out what other aspects are influencing the build-versus-buy decision, check out our Build-Versus-Buy Guide here.

This article is published in ServiceMax Field Service Digital on June 22nd, 2021

Managing your Quality and Engineering Changes

February 2021, breaking news, your engineering team issues a mandatory engineering change to all product models ABC built between 2011 – 2013. “The gearbox needs a retrofit to avoid potential injury and claims”.

Change the verbatim, the dates or the technical details. I guess you’ll recognise the scenario. Whether the origin of the change is quality, compliance, engineering maturity or commercially driven, managing engineering changes is a big deal. A big deal because you don’t want claims. You don’t want your brand image tarnished. You don’t want cost overruns. It’s a big deal because you want to convert a negative into a positive.

Engineering changes extend into the operational life cycle of a product

I once believed every product was 100% engineered before it found its way onto the markets. Having run service organisations for more than 25 years I’ve reduced my confidence in this percentage year over year. Don’t get me wrong, I don’t mean to say that is a bad thing, but I do want to emphasise that acknowledging that anything less than 100% puts a burden on the service organisation to build mitigating processes.

I’ve seen organisations introduce 80% engineered products by business model design, as they need the usage feedback to finalise the engineering. Other organisations aim at a near 100% engineered product, only to discover their products are used in unforeseen contexts leading to post-GA modifications. And in the digital age I see more and more organisations enhancing product capabilities of physical products by ‘selling’ software upgrade options.

Where is my Installed Base?

All variants share a common premise: you need to have installed base visibility as well as an accurate as-maintained BoM to be able to manage your engineering changes effectively.

To illustrate this, I’ll give an example on the other end of the spectrum. If you don’t know where the affected products are, and you have a compliance obligation to reach out to the product/ asset owners, you can only go public … and that is not good for your brand image … as many car manufacturers and food companies will confirm.

In our Global Customer Transformation (GCT) practice we often see a hybrid. Some units sold have an associated warranty and/ or service contract, other units are not visible because they are sold via an indirect channel and/or the owner does not want to be visible. What engineering change managers need is a ‘workbench’ to create a near-complete installed base from multiple data sources.

Now we have a near-complete installed base, we can filter on model ABC with a commissioning date between 2011 – 2013. 

Spread the Wealth

A common characteristic of engineering changes is that they tend to come at an inconvenient time, on top of the existing workload. What potentially complicates things is the combination of a) the availability of replacement parts and b) the customer expectation to be first in line.

Let me give you an illustration that reveals my age. In 1989 Intel launched the 80486 processor. High-end customers upped the specs of their PC’s with the 80487 co-processor. Then a researcher detected a mathematical flaw in the co-processor. Immediately people wanted a replacement. The supply chain was stocked with the flawed 80487 revision 1, whilst Intel had to ramp the production and shipments of revision 2. In analogy to Covid-19 vaccinations you can imagine this became a puzzle of priorities and constant shifting plans.

In our GCT practice we talk to Engineering Change Managers. They receive so called product bulletins on a regular basis. And each time they need to make decisions on when to launch an engineering change campaign while weighing brand image, quality and cost. And once they have launched a campaign, they want to know the progress. But the most asked ‘feature’ by Engineering Change Managers is the ability to adapt the priorities in a campaign based on progress, the amount of ‘wealth’, the voice of the customer and the impact on existing SLA & Contract commitments. Regarding the latter, I’ll dedicate my next blog on Engineering Change prioritisation strategies. 

Digital EC’s and Retrofit Kits as Upsell and Lock-in instrument

I’d like to change the ‘energy level’ of the conversation. Engineering changes are not always negative from a quality, financial or brand image perspective.

There is a limit to the number of mechanical and electrical changes you can make to a product post commissioning using Retrofit Kits, but more modern products have an ever-growing digital component. Digital engineering maturity continues post commissioning.Do you own a Sonos sound system, a Tesla, a digital press? The physical product you bought remains the same, while over-the-air digital EC’s deliver a steady stream of new features and enhancements. Whether your organisation uses this EC-stream for lock-in purposes or upsell revenue, at the core you need an asset centric infrastructure with comprehensive engineering change capabilities.

This article is published in ServiceMax Field Service Digital on March 2nd, 2021

Back to the Future with Design-for-Service

Yes, it’s really happening!”. That was my feeling when a customer of ServiceMax contacted me to enlighten them on the Design-for-Service concept. Six years ago, they started their service transformation journey to get Visibility and Control. Now they are moving the needle towards Excellence and Growth. What makes this ask even more ‘special’, is that it is the engineering department that wants to know what service needs to deliver value.

Black swan

Most of us will have plenty of examples where engineering asks technicians to record all kind of diagnostics, reason and fault codes during the service execution. What happens with that data? Will the technician feel taken seriously when servicing yet another piece of equipment that is engineered for manufacturing?

Thus, you can imagine my positive surprise when engineering wants to ‘learn’ what service needs and what modern service execution tools are capable of. It is a true win-win when both service and engineering are seeking the joint benefit of their siloed effort. 

  1. Technicians will get a return on their administrative effort when they see that it results in easier-to-maintain products.
  2. Engineering will get the justification to fund their design-for-service effort when they see that service can improve the margin and drive new revenue streams.

Attach Rates

The concept of design-for-service is not new. Still many organisations only apply design-for-manufacturing. The latter concept drives for cost optimisation in the manufacturing process of a product at the expense of a potential higher maintenance cost over the life cycle of the product. Design-for-service optimises both the manufacturing and the maintenance aspects of a product. Yes, I hear you. What about TCO, total cost of ownership? TCO is great, but TCO only works when capital expenditures (Capex) and operating expenses (Opex) are evaluated by a single entity.

Cutting a few corners and dialling it down into a single metric, have a look at your Attach Rates. You can imagine that when engineering puts more effort/ cost into the design of the product, the selling price of the product goes up. Balancing the effort equation, you have the maintenance cost going down due to better quality and more efficient maintenance delivery. On top of that, the engineering effort may also result in the creation of new types of service offerings like availability services and data-monetisation. To reap the benefits post point of sales, you need to have or get your customer ‘attached’.

Attach Rate: the percentage of your installed base that has an associated service contract with your organisation

Getting ‘attached’ customers might be easier when you sell your product via your own direct sales channel versus units sold via your indirect channel, read dealers and resellers. That all changes when engineering starts including concepts like ‘digital activation’ of the product.

Serviceability

When engineering defines the Product, the result is captured in a BOM (Bill of Material). So far, nothing new, this is design-for-manufacturing 101. When we start designing-for-service, we need to make a number of explicit decisions. Amongst those I’m highlighting two of them:

  1. What components from the BOM are serviceable?
  2. What service delivery model is applicable for that component?

First, is the product serviceable at all? If it remains a single unit, you have made the implicit choice to exchange the whole unit with the option to have the defect unit repaired or scrapped at a depot. This model may be a fit for some products but the larger, expensive and critical the product, the more you’ll need to ‘open the box’.

Second, in the BOM you’ll have to identify those components that are serviceable. For each component in the Service-BOM or SPL (Spare Parts List) you’ll have to classify the part.

  1. FRU: Field Replaceable Unit – the repair/ replace of the component requires specialised skills of a technician
  2. CRU: Customer Replaceable Unit – the repair/ replace of the component can be done by any customer (no explicit skills required)
  3. DRU: Depot Repairable Unit – the repair cannot be done in the field, but requires the asset to come to a depot where dedicated skills, tooling and components are available

Old-school textbook?

I’ve come to learn the above two service design considerations when I stumbled into my first service job at IBM in 1993. Though I did not grasp the full impact at first, the more I talk to today’s customers, the more I am convinced we need to re-establish the handshake with engineering to deliver above and beyond the service value promise. 

Handshake

In my session with this customer, I had conversation with a very adept, eager and forward-looking engineer. He understood the consequences of engineering choices for the service delivery … and ultimately the impact to cost, revenue and customer expectation.

Next, he wanted to know how service delivery constraints and possibilities would impact his engineering process. It was clear to him that state-of-the-art service execution tooling, with a high degree of asset centricity would enable him to create a positive ROI for his design-for-service efforts.

This article is published in ServiceMax Field Service Digital on December 10th, 2020

Finding Revenue Leakage in your Service Business – part 1

Have you ever had to Credit or Discount an invoice? If the answer is ‘yes’ then you have leakage, if the answer is ‘no’ then you definitely have leakage.

How do you respond to the Aberdeen finding that best-in-class companies have a whopping 14% warranty & contract leakage? Denial, absurd, overstated, or … wait-a-minute, maybe I’m not looking at the right KPIs to detect leakage. Once you acknowledge leakage exists in your organisation, wouldn’t you go all the way to manage leakage out of your business, knowing it has a direct impact on your bottom line?

Defining leakage

What is service leakage? In the simplest terminology: you are losing money. And the bad news is that it often happens without you knowing or realising it.

We can distinguish two types of service leakage:

  1. Non-Contract leakage : the periods in the operational life cycle of an asset not covered by warranty and/or a service contract (sometimes this is also called T&M-leakage because service outside a contract classifies as T&M).
  2. Contract leakage: an asset is covered by warranty and/ or a service contract but in your service delivery you provide more and/or a higher level of service than the customer is entitled to. 

Contract leakage typically occurs when service organisations do not know and/or manage expiration dates of warranty and contracts. Non-contract leakage typically occurs when the entitlement process is fragmented and/ or when the information is not accessible to all involved service actors.

Let’s mention a couple of common scenarios:

  • A customer claims a defect within the warranty period. You correctly entitle the job as ‘warranty’. On site the technician detects ‘customer induced damage’. The technician performs the repair anyhow and there is no charge to the customer.
  • A customer is entitled to next day service but presses you to fix the machine today without paying an additional fee. Because your technicians are not busy today, you give in to the request.
  • A customer makes a service request assuming the current contract is still active. Upon entitlement check you detect it has expired three months ago. The customer agrees to renew the contract per current date. You incur 3 months loss in contract revenue.
  • A customer has multiple machines of the same model. Only one of them is covered by a contract. The single contract line is used to entitle work on all of them because the customer always uses the same serial number.

Service Leaks are not the problem; they are the symptom. They reveal a disconnect between process design and actual behaviour. Denial of leakage increases the disconnect.

Impact of leakage

One of the unfortunate things in business is that the cost always hits you – now, if you are so good at capturing cost why do you allow revenue to slip through your fingers? How do you think your shareholders would enjoy hearing that you worked on a customer’s asset and neglected to bill them? 

Another way to look at the impact of leakage is to establish how much extra revenue would need to found above and beyond what you are already billing for. Let me paint a picture for you, as we have established you capture all of your costs so any leakage (missed revenue) that you capture will have a 100% positive impact to your bottom line – every dollar billed will be a full dollar of equivalent gross margin. So, let’s say you were running at 20% margin as a service organisation and you allowed $100,000 to leak through your service organisation, now a service org would need to go and find $500,000 of brand spanking new business to offset this $100,000 leakage just to break even. How hard is it for a business to find $500,000 of extra revenue with the same resources? 

Actually, quite easy – set your system up to minimise the risk of leakage….

On top of the cost, revenue and margin contribution impacts, customer expectation is a big one. Leakage has a very large behavioural component. If a customer is used to getting service for free, it becomes very difficult to start charging for it. If a customer ‘discovers’ you can’t manage your entitlements correctly, this may lead to ‘unwanted’ service calls.

A similar behavioural impact can be expected on the technician’s end. A technician chose his job because he/she wants to fix things and be a hero on site. A technician did not select the job to do admin and become a contract-referee. Thus, if you do not empower your technicians with the right tools and information, do not expect any cost/revenue sensitivity, they will go for CSAT and please the customer.

Finding leakage

Do you find leakage or is it a matter of ‘capturing’ it? You are delivering all of the services that create the opportunity for leakage, so you already know where it is, you just need the correct tools to capture it, Oh and by the way,  they are never humans and excel… You need a robust process and a software solution to support that process and remove ‘chance’ from the equation. 

Detecting, quantifying and finding the origin of leakage in your organisation is a process like remedying a leaky roof. You’ll need adjacent ‘instruments’ to find the source.

Remedying leakage

The first step towards remedying leakage is accepting its existence. Once you have made leakage visible, you can start actioning it. And in general those actions fall into three categories:

  1. Stop delivering free service; this has a direct cost reduction benefit.
  2. Continue delivering ‘free’ service and start charging for it; this will increase both your revenue and your margin; the additional margin is 100% as we have shown you have already incurred the cost.
  3. Continue delivering ‘free’ service and use it as collateral for something else of value; this benefit is harder to manage, but we can argue it is good for CSAT and can be used during contract renewal to counter cost & rate reduction arguments from your customer.

This article is published in ServiceMax Field Service Digital on November 10th, 2020

Post-Crisis Handbook – Managing the Backlog

We’ve been talking about disruption for quite a while, but many could not fathom out its consequences or that it would even hit us. Nations, organisations and individuals have discovered that their business continuity plans could not mitigate the impact.

Now we’re past the initial shock, what is business-as-usual going to look like? How do we pick-up and how do we process the backlog created by three months of lock-down?

In the previous chapter of our post-crisis handbook @Daniel Brabec provided four handles that are top of mind when navigating the service world in the New Normal. In this chapter we will focus on managing the backlog.

Perpetual Backlogs

Right now, all focus is on Covid-19 and its impacts. But if you look deeper, you will see that many COVID-related themes have pre-existed in varying degrees; its only now that we look at them through a magnifying glass.

  • Remote service procedures have been around for more than 30 years. Rethinking business continuity plans will likely expedite their adoption.
  • Digital tools allow you to remodel your business processes and simulate the amount and mode of touch points. Social distancing guidelines add an additional ingredient to that business process (re)engineering.
  • Balancing the availability of technician capacity and contracted workload is an ongoing exercise for each service-focused executive. Disruptions and imbalance exist at all times. Only Covid-19 is a major shock, illustrating that business-as-usual balancing mechanisms can’t cope.

Balancing Supply & Demand

For about three months many businesses have seen huge fluctuations in both the volume of work and the availability of resources.

The existing workforce has been confined to work from home, has been furloughed or has taken sick/ care leave. In addition, those that are available have to spend more time on a job for extra precautionary activities. In all, you have less capacity to execute work.

From a workload perspective we see that many jobs have been pushed out. We see some equipment being ‘sweated’ to maximum usage (e.g. medical diagnostic equipment) and others going into hibernation (e.g. aircraft engines). This will have a huge impact on the life cycle of the asset warranting a more asset centric approach.

The Impact of the Backlog

Just try to imagine all the impacts a work-related backlog might have on the business:

  • Compliance: For three months Preventive Maintenance (PM) and Inspection jobs have been pushed out. All time-based schedules and counters will see non-conformity. To what degree can you apply flexibility to compliance dates and how do you manage those shifts?
  • Service Level Agreement attainment: There are many relevant questions that need to be answered in the measurement of SLA performance. How does one measure uptime for e.g. medical diagnostic equipment that has been running 24/7? How do you measure uptime of equipment for furloughed organisations? And How do penalty clauses apply; or is the pandemic considered an act-of-god? And finally, how do you filter/ clean metrics that are impacted by Covid-19?
  • Contract renewal: This possible renewal scenario might play out between organizations and customers. Procurement at the customer may say “We’ve not had the benefit of contracted services for three months, so we will only renew in three months” or “We’ll only renew after completion of the pushed-out PM jobs”. Try to imagine and forecast the impact on your contract revenue streams.
  • Dispatching priorities: How does contract renewal drive the priorities for rescheduling the PM backlog? If you have more jobs than capacity, what jobs get priority and what will be the impact to the above three bullets?
  • Workforce capacity planning: Now we have more jobs than capacity, how long will it take us to process the backlog? Will we strike the backlog, or will we contract additional/ temporary capacity? What jobs will we assign to 3rd party technicians and what jobs will our own people do?

To reiterate, the above impacts are not only related to Covid-19, they are universal and timeless. You might recognise yourself in the synthesis of pre-Covid-19 quotes made by various companies: “At present we can only deliver on 85% of the contracted work due to unavailability of skilled resources. In the execution of work, we take calculated business risks balancing compliance, cost and revenue streams”.

Running Scenarios

Ultimately, the challenge for any organisation is the balancing of supply of resources and the demand of (contracted) work. And as we know by now, we have to be able to handle disruption in various degrees of intensity. This brings us to the requirement of being able to run scenarios.

Some examples:

  • What is the revenue & compliance risk of executing 85% of the jobs versus adding resources to get to 95% execution?
  • What happens to my contract renewals, SLA attainment and penalty clauses when I prioritise pushed-out jobs of gold-contracts over bronze-contracts?
  • Can I use knowledge on capacity availability in my service-sales process when making commitments on execution dates?

In its most generic form, running scenarios will help you making informed decisions on both capacity/ resource management and prioritising (contracted) workload.

The New Normal is Business-as-Usual

So, what is so new about this New Normal? Is it new? Or is it business-as-usual under a magnifying glass? I believe it is the latter. I believe backlog management in the past has focused a lot on the transactional aspects. Now the disruption is visible to all, I believe the time is right to make backlog management a strategic decision-making function.

This article is published in Field Technologies Online on June 22nd, 2020.

Selling Preventive Maintenance as a Value Add

Selling preventive maintenance is not what it used to be. In the old days a manufacturer could use its expert position to prescribe a maintenance scheme. Today, a combination of emerging technologies and pressure from buyers to do it cheaper/ smarter warrant a revisiting of the value proposition of preventive maintenance.

PM = Periodical Maintenance

As acronym we use PM. When talking we utter the words preventive maintenance. But what do we really mean?

  • Planned Maintenance
  • Periodical Maintenance
  • Predictive Maintenance
  • Prescriptive Maintenance

Analysing a lot of service contracts offered by OEMs we still see most of the maintenance is periodical or counter based. Just like the maintenance interval for your car; a PM each year or at 15,000 km.

All those periodical or counter based maintenance jobs are good service revenue for your service organisations But what happens when customers start challenging you? What if the customer has access to knowledge that amends or contradicts the engineering assumptions that led to the definition of your current maintenance intervals?

Buyers seek to reduce maintenance cost

In a world where people are more vocal, we see customers expecting things to work and buyers seeking to reduce maintenance cost. These expectations impact the way we sell service contracts. 

Selling is more straight forward when you can see a direct relationship between the pain and the gain. Such a link is obvious for installation and break-fix activities. But it is less apparent for preventive maintenance. Try to picture buyers asking these questions:

  • What does PM prevent and what is the risk that remains?
  • What is the rationale of the current maintenance interval?
  • Nothing happened last year. What will happen if we skip or delay a PM?
  • Can you dissect the PM job in activities (show me what you do) and is it really necessary to have all those activities done by an experienced/ expensive technician as yours?
  • Can we do pieces of the PM job ourselves?

You get the gist of the conversation and know where it is leading  less cost for your customer at the expense of less PM revenue for your service organisation.

Problem-Fix curve

What complicates the selling of service, is that in most scenarios the buyer and the customer/ user are not the same person. You may convince the user of a piece of equipment to do preventive maintenance, the buyer on the other hand has a different set of objectives. Most likely the buyer will push you on a path towards commoditising and cannibalising your PM services. All in order to reduce cost.

Rediscovering value

To stay ahead of the game let’s dissect PM along the lines of value creation for the customer. High level you can split a PM into three pieces:

  1. The execution of the maintenance activities
  2. The reporting on those activities
  3. The communication and interpretation of the results

Ask your customers to rate the value of each of those pieces. It’s probable that you will find that the business value of PM to a lesser extent is in the execution and more in the reporting and communication.

Maybe you pride yourself in your uniqueness of execution, whereas the customer might perceive it as a commodity. If also reporting and communication are on par, you may face price erosion.

If your customer needs the PM report for compliance or insurance purposes, the value of the report increases. When you consider that PM is often a play of risk and liability, you can price the value of your brand. Example: It does make a difference to an insurer if a yearly PM/ inspection is performed by a triple A company or a middle of the road company.

Communication value comes into play when your customer expects you to be a partner rather than a supplier. 

  • Supplier – “just send me the PM report, I’ll read and interpret it myself. When I need assistance, I’ll contact you.”
  • Partner – “help me interpret the findings and consequences of the PM. How does this impact my business?”.

In the latter situation you can monetise the communication beyond the effort of having a conversation for a couple of hours. PM can thus elevate from an obligatory periodical execution to an instrument of customer satisfaction and cross- and upselling.

Repackaging the preventive maintenance offering

In order to retain and expand your PM revenue stream in a context where the buyers move to reduce their spend, do go in discovery mode and (re)define preventive maintenance. PM is not a singular black box once defined by somebody in engineering with a product focus. Modern PM is a menu of choices (and consequences) for your buyer based on the usage profile of the product, budget and risk.

This article is published in Field Service News Jan/Feb 2020 issue.