Digital Thread: How the Service Bill of Materials Enables Cross-selling & Upselling

It’s 2010, and an OEM has asked me to blueprint their after-sales organization. I went to our sales executive and asked, “What do we tell our customers about life expectancy and maintenance costs when we sell the product?” He looked at me with a confused look.

Why is this important? Because, if you want to cross-sell and upsell services in the after-sales domain, you need to know what value was promised when the product was sold. This is where the service manual and the Service Bill of Materials come into play.

This blog is part 3 in a series of three:

The value promise of the product sale

My sales executive sold complex capital equipment. For each product in his portfolio, engineering provided him with technical specifications describing the output capabilities. He would ask customers for their intended use profile and select the model that had a matching output bandwidth. To not complicate his CapEx sale, he would avoid a conversation on:

  • How many years will the product be able to sustain specified output levels?
  • What is the expected decline in output levels given the customer use profile?
  • What maintenance efforts are required to sustain product specifications?

Upon delivery and title passage of the product, the buyer would have access to the operator and service manual. These provided insights into the ‘size of effort’ required to use and sustain the product. If a total cost of ownership calculation were a prerequisite to the product sale, my sales executive would defer the calculation of the OpEx piece to the after-sales department.

Total cost of ownership

I’ll skip the semantics on if we should talk about the total cost of ownership or lifecycle cost. The idea is to create an understanding of what it costs to sustain the product over a prolonged period of time while maintaining output specifications.

Once more we can draw on the intellectual property and effort from engineering. As we’ve mentioned in part 1 of this series, the service manual describes the efforts needed to maintain nominal output specifications. To put it another way for the customer, “If you maintain your product as stated in this document, we, the OEM, guarantee the output specifications.” Thus, when we cost/price those activities, we have a pretty neat approximation of the OpEx piece of TCO.

Title passage

When an OEM is in the business of CapEx sales, it will have a title passage of products. Beyond title passage, all pains and gains of the product transfer to its owner. Now it is the responsibility of the owner to act upon the instructions in the service manual. Most likely there will be a clause saying that non-compliance with these instructions ‘may’ void OEM output level guarantees. There may be a clause that voids the warranty when non-authorized parties perform maintenance activities on the product.

This is where it gets interesting and dualistic at the same time! On the one hand, the OEM bestows the risk of owning the product onto the buyer. On the other hand, the OEM wants something from the product buyer post-title passage—“buy my maintenance services.”

This happens in a context where the owner of the product has the legal right to choose to follow the user manual instructions, to ignore or deviate from them. The owner can also choose to perform the activities themselves or to outsource. If your business model is driven by title passage, you can’t force a product buyer to buy associated services. You can only entice product owners to buy your services.

Cross and upsell

The first step to cross and upsell is establishing a baseline on what comes included with the product sale and what is extra. If the product is sold with a warranty, the warranty conditions will define what is included and what is not. It is important to clarify that a warranty is predominantly promising the correct working of the product. Not a ‘free pass’ to mitigate actual wear & tear as a result of using the product.

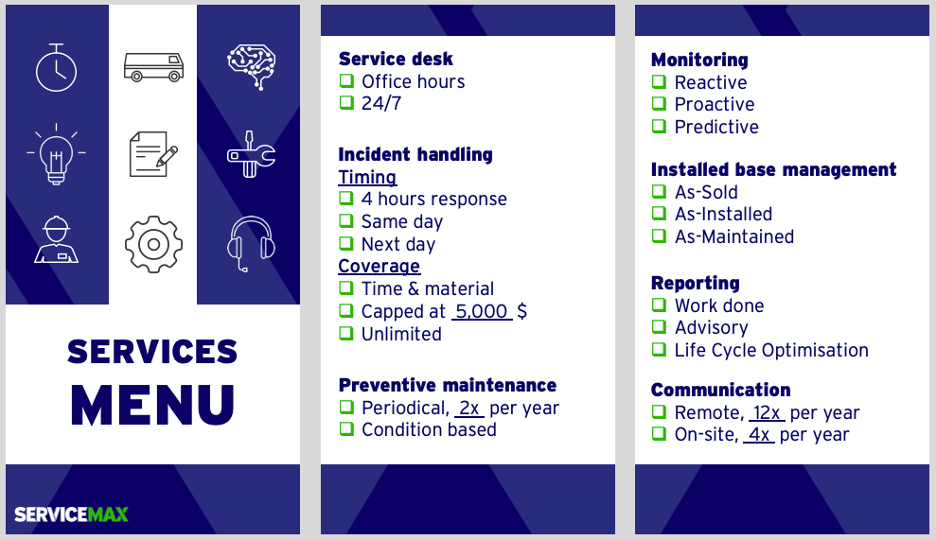
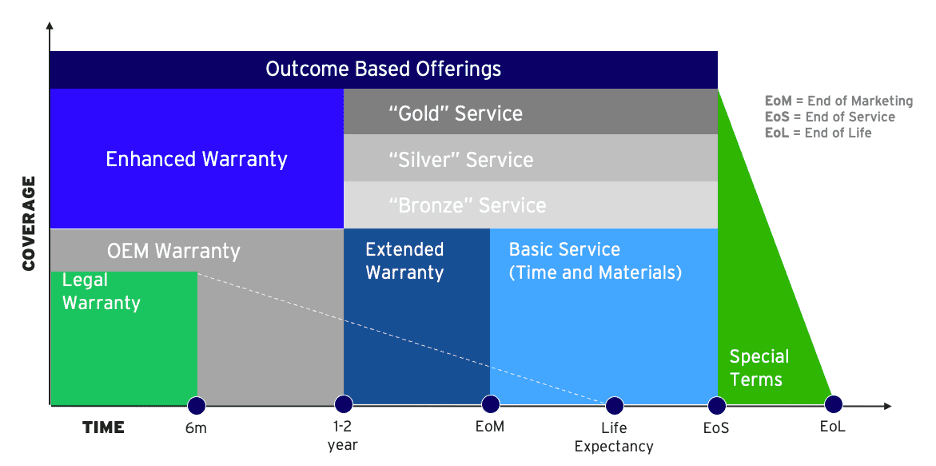
The second step to cross and upsell is having a conversation on how the owner will use the product. When the use is exactly as envisioned by engineering, then the operating and service manual will define the maintenance standard for sustaining the output specifications. When the customer uses the product in different settings, you may want to introduce ‘bundles’ of maintenance activities associated with low, medium, and high usage. Call them bronze, silver, or gold. For more granular services you may want to use a concept like a menu card.

Once you have jointly agreed on what maintenance activities are required to sustain output specifications given said use profile, the final step is defining who does what. This is a risk versus cost conversation. Either the product owner bears the cost and risk of using the product or those are outsourced to a service provider/OEM at an agreed price.

Companies that have a large installed base of products and trained internal technicians may choose to execute the service manual activities themselves. Others may evaluate the risk versus cost differently, and buy services ranging from preventive maintenance to full service. Mastering the risk/cost conversation in conjunction with intellectual capital captured in the Service-BoM and service manual will become your toolset for cross-selling and upselling.

Digital thread

In three blogs we’ve spotlighted the Service Bill of Materials through the lenses of cross & upsell, system of record, and linking engineering to service. We’ve seen the value of the digital thread spanning engineering, manufacturing, service, and sales—proving value across the entire product lifecycle.

This article is published on Field Service Digital.

Rental in Transition

Last week I went to Riga to participate in the annual convention of the European Rental Association. With the theme ‘Rental in Transition’ the convention rightfully worded the pivotal junction in time. Fuelled by the European Green Deal we are poised to rebuild our economy towards net zero emmisions. This means construction will boom requiring lots of construction equipment. The big challenge for OEM, dealer, rental and construction companies will be to manage the installed base of construction equipment from a carbon footprint and emmisions perspective.

Collective bargaining

When the representative of the EU, the consultant from the Boston Consulting Group and the chairman of the European Construction Industry Federation talked about the need and drivers for transition, I had this nagging question. Suppose I own a construction equipment fleet of 1b$, the majority still being internal combustion engine (ICE) based, how do I monetise that investment if the awarding of new construction jobs is based on lower carbon footprint and emission levels?

This is big. This is a challenge of major proportions. Though the delegates subscribed to the mid-term sustainability and transformation goals, for the short-term there’s that ominous questionmark of the how-to. The impact and magnititude of the sustainability transition shows how OEM, dealer, rental, construction companies and legislators are intertwined. This requires a serious dose of collective bargaining.

Preparing for the transition

Regardless of how the transition is going to pan out, for all players in the value chain it is imperative to prepare for the transition. It will become increasingly important to understand the usage profile of construction equipment versus generic equipment attributes.

Let me explain with an example in the car rental industry. When you rent a car it typically comes with a mileage allotment per day. If you drive more, you pay more. If you drive less you still pay the daily rate. You could also split the rental model in an ‘availability’ and ‘usage’ component. Especially if the usage component drives carbon and emissions output, splitting the rental model can motivate the user for a more sustainable use.

This simple example sits at the core of asset-centric business models. It’s not about owning of having an asset, it’s about using it. See here the incentive to digitally transform your business and get access to equipment usage information. Bye the way, if you are catering to the larger construction companies, you will know that providing the usage data of construction equipment is a critical element of the rental service.

Carbon offsetting

Most of the delegates flew to Riga. Upon buying their airline ticket each had a possibility to purchase the carbon-offsetting option. How many did buy that option? Today the majority of the rental companies offer a similar carbon-offsetting option for rental equipment. How often is that option selected? A brief survey amonst the delegates revealed the non-scientific value of ±5%. Rental today is a very price sensitive industry.

When I look at the construction deadlock in my own country, the Netherlands, I see that each new project must submit a carbon and emissions overview before even getting a building permit. We heard the EU representative make remarks along similar lines. “We will use carrot and stick”. And we know of sustainability-forefront-cities only awarding projects to eco-frontrunners.

Does this mean that we can only use electric or hydrogen based equipment for future construction projects? Contemplating on the sheer size of the sustainability challenge, the answer will be ‘no’. There simply isn’t enough construction equipment to get all the work done. But if you want to continue using ICE equipment, you need to get smart at carbon-offsetting options. At the conference we heard that a CO2 calculator is a good start, but we need to make it easier to use and equipment usage based.

Beyond Equipment

For the mid and longer term we have an adject challenge when replacing ICE equipment with electric and hydrogen based alternatives. For ICE equipment we can build on the existing infrastructure of fosile fuels. And for remote locations we can very easy offer a fuel management option. 

If we want to deploy electric and hydrogen based equipment, it often means we have to supply the complete EV or hydrogen powertrain as well. This implies that the rental paradigm will change from equipment rental to complete solutions rental. From an asset management and equipment availability perspective that will mean that the complexity will increase. This will feed the argument for accelerated digital transformation.

In completely different acumen we could label this as ‘servitisation’. When the contractor needs to excavate 100 tonnes of rock, he’ll need an excavator, dumpster truck and complete power train. As food for thought for rental, would it be too far off to start selling electricity/ hydrogen as well?

Beyond Riga

It was great to be in Riga. To hear so many people in the industry. The challenge is big. Yes, there are some threats. Yes, there is a level of denial and green-washing too. On the other hand, the challenge provides a great number of opportunities too. Those who embrace those challenges and embark on their digital transformation journey, those will have the upper hand in a rental market that is in transition.

This article is published on Field Service Digital.

Previous blog on rental.

Maximising Asset Availability for Rental Equipment

Four years ago we moved to the country side and bought an old farmhouse on a large plot of land. Having big construction and landscaping plans we regularly rented all kind of equipment to get the job done. The journey I experienced was tough for the companies that rent out equipment and for my DIY-projects progress. I wish some of these rental companies had state-of-the-art service execution systems, such they could drive both a better customer experience and value delivery.

Job and Equipment planning is tough

The most important thing I’ve learnt in those four years of home improvement is that a piece of rental equipment is ‘just’ a small piece of the planning puzzle. As an example, for my landscaping an element of the work was the relocation of a lot of dirt. For this I needed a (mini) excavator. The availability of the excavator was intricately entangled with ten or more other planning items. You can imagine my surprise/ frustration when the excavator wasn’t available on its due date … and the alternative had only half the capacity.

This is one of many examples I accumulated over four years. As a result I’ve become proficient in reverse engineering the processes of the rental agencies. It’s tough for rental agencies too. If only they had better visibility and planning tools. Speaking of the devil, I happen to work for a company that provides those tools and has implemented them in both business-to-business and business-to-consumer contexts.

The happy path

A rental fleet represents a significant investment so it may sound obvious to know where all that equipment is, and in what state. When you visit a rental yard or a construction site it becomes clear that knowing what-is-where is not that easy. If my personal experiences are representative for equipment visibilty, then WYSIWYG is a rather common implementation.

WYSIWYG works fine when the rental process follows the happy path. Meaning: actual pickup and return date are as planned/ booked; equipment doesn’t break and/or require servicing; no conflicts between availability and demand for equipment.

Going back to my landscaping job and the excavator. With half the capacity, my rental period mathematically doubled. With half the capacity, interlinked activities got pushed out as well causing additional delays. In the end my rental period tripled. Because ‘my’ excavator originally was booked by another customer, the rental agency phoned me in the third week to expedite its return. I was not happy, and certainly I did not pay anymore than the original contracted amount.

Does this sound familiar? Can you imagine how much it costs for a rental agency to mitigate the not-so-happy-path? Cost in headcount and lost revenue generation?

Reducing Turn-Around-Time?

Knowing that a piece of rental equipment is only making money when it is rented out, a key driver is to reduce the so-called turn-around-time (TAT). The time it takes to clean, inspect and service an equipment after its return, making it available for the next customer.

Suppose you have a rental fleet valued at 1b$, then your daily cost for interest and depreciation are roughly half a million $ per day (based on a annuity scheme at 4% interest and five year term). Thus if you can turn TAT-days into rental-days, cost-days become revenue-days. Suppose each piece of equipment has four rental periods per year, and you reduce your TAT by one day, you save 2m$ in cost. Add your sales margin and we’re talking serious numbers when renting out equipment back-to-back.

Defining servicing priorities

This brings us to the most challenging issue in the rental business. Instead of reducing the TAT for every equipment upon return using FiFo, you want to prioritise those units that have an adjacent rental period. By applying prioritisation rules, you can better plan the capacity of the rental return and servicing functions as well as making sure that the most revenue generating units as turned around first.

An example of the non-priortised 

We’ve seen examples where excavators, dumpster trucks and cranes not having an adjacent renter are ‘left’ at the customer site post rental period to save yard space. To ‘free-up’ capacity for the turn-around team in favour of ‘hot rentals’.

Managing the lifecycle of the equipment?

Rental equipment can have a rough life. Let me be honest. I sweated ‘my’ excavator to an extent I would not have done if I owned the excavator. In setting their rates, rental companies take these use cases into account. After each rental period there is a decision to be made: do we maintain the existing equipment or do we replace it?

The math behind the decision is simple: is the earning capacity of the equipment more or less than the cost to sustain it? To make the equation come to live, you need both historical data and forward looking data.

Keeping a record of historical data is pretty much possible in any business tool. For the forward looking piece you’ll need a tool that supports asset centric use cases for your assets.

  • Plotting the future preventive maintenance activities
  • Plotting the future calibration and certification activities
  • Aligning future service interventions such they don’t break or clash with rental periods
  • Create reporting that depicts plan versus actual versus outlook on equipment level

In the past four years I’ve learnt a lot about the rental business. Though a rental fleet is a significant asset on the balance sheet, in rental operations we still see a lot of appointment centric and reactive business practices. Modern day tools allow rental companies to apply asset centric business practices. Becoming proactive and getting a better return on the asset investment.

This article is published on Field Service Digital.

How do you know you are making money on your service contracts?

In my previous life I sold service contracts for a large OEM. Like many service executives, I was proud of profit margins in the range of 40-60%. But when I talked to my CFO, the numbers didn’t compute in the bigger organisational picture. Let me take you on a narrative of planned versus actual contract profitability and how I gained control over my margin contribution.

Reactive margin contribution

It is still early in the new fiscal year. I have good hopes of making my numbers. Of course I know I have a few ‘high maintenance’ customers. At the same time I have a few ‘cash cow’ service contracts. They will balance out, I’m confident. 

Fast forwarding to the last quarter of the year. Am I still that confident? Obviously I have more insights into my year-to-date cost. Did everything pan out as expected? What options do I have in the remaing weeks of the year to make my numbers?

What I am trying to say. No matter how good my predictions and projections were, actual performance has a tendency to differ from planned performance. Maybe less on aggregate level, but certainly on individual customer or contract level. 

I want to speak the same language as my CFO to better align with the corporate agenda.

It was my ambition to be more in control. Not to depend on reactive and aggregate margin contribution, but to be proactive and predictive on individual customer/ contract level. 

Defining the selling price

When I started selling service contracts I had to brush up my sales 101. How do I define the seling price of my service contracts. I had three paradigms at my disposal.

  • Selling price = Cost plus Margin (aka Cost Plus)
  • Margin = Selling price minus Cost
  • Cost = Selling price minus Margin

If I had full visibility on cost and I had the upper hand in the commercials, then cost plus would work for me. My reality was that cost was more of a guesstimate. Rearding the margin, we had internal margin objectives. But in the commercial arena we often had to give in. This led to the acceptance of the second equation. Margin was not a driver but a result. Margin was reactive. 

Expanding on the narrative in the first paragraph: in the last quarter of the fiscal year the CFO would become vocal using the third equation. If the selling price was an unalterable fact and the margins were falling low, then only available option was to cut my cost.

I want to get ahead of the game to deliver predictable margin contribution.

Influence cost while you can

I went back to my drawing board. How shall I construct my service contracts such that I can monitor all three variables: cost, revenue and margin? In addition I implemented the basic financial concept of planned versus actual and outlook in my service execution process.

After having had my service menucard conversation with my customer, I would cost all those entitlements, resulting in the sum of planned cost. When the contract went into service-delivery mode I would keep a tally on the actual cost. If actual cost develops in a bandwidth of say 10% or planned cost, I knew I would deliver on the expected margin.

Beyond the actual cost development, modern day service execution tools also provide visibility of future service activies. Thus you can create a cost outlook as well. Now you have all the info to make the right decision in real-time, protecting your margins.

Predictive margin contribution

Why all this fuss? Apart from my personal and service domain motivation, my CFO told me loud and clear: I dislike surprises, I want predictability. If only I could cater to the CFO’s wants, maybe I could get access to budget to mature my processes.

I knew I was probably the single largest margin contributor to my companies result. Maybe more out of luck than by design. If only I could invest in tools that would give me that control and predictability.

Better and competitive pricing

Beyond the CFO persona I want to highlight role and importance of the Service-Sales persona. Setting the selling price for a service contract is a subtle process. Price pressure is prevalent in pretty much every sales cycle. The Service-Sales persona needs handles to balance revenue versus margin contribution.

Asset owners want maximum uptime at lowest operational cost.

When my cost insights were on guesstimate level, cost plus did occasionally result in non-competive price points. When my cost guesstimate was too low, my margin took a hit. When I started monitoring the actual margin, I got a good idea if I had priced my service contract ‘fairly’. Deliberately I’ve put the word fairly between quotes. High margins may be good for my bottom line, but from a customer perspective high margins may not be sustainable. Margin insights were an absolute must have for me when renewing/ renegotiating my service contracts.

This article is published on Diginomica and Field Service Digital.

Is the Service Menu Card Replacing Bronze, Silver and Gold Contracts?

During last week’s High Tech Manufacturing event in the Netherlands, we reimagined tomorrow’s service delivery in the context of vocal and demanding customers. If customers expect products to work, is it enough to mitigate downtime, or should you know why your products work and in the context of customer usage? Is your current services portfolio in line with tomorrow’s customer expectations?

Bronze, Silver & Gold Contracts

In reviewing the services portfolio I used words like bronze, silver, and gold contracts to paint a continuum of reactive to proactive and predictive contracts. In an earlier blog on Mind the Gap, I used gold to quantify your maximum services revenue.

Proverbially the gold contract is the ultimate bundle of services to guarantee the uptime of the equipment. It’s not really product-as-a-service, as the customer still needs to buy both the product and a service contract, but outcome-wise it is the next best thing.

Just like with any product or service that is sold today, B2B or B2C, the big question is: who decides what is put into the bundle? Is it a seller-push or a buyer-pull?

This is exactly the challenge the high-tech manufactures are facing today. Based on our discussions during the event, the consensus was: we need to provide more choice and autonomy to our customers. Even if the installed product is the same, the usage context is different case by case.

Product Push vs. Usage Pull

It is not uncommon that the current bronze, silver, and gold bundles are based on product characteristics. When we sell expensive and/or complex products, we tend to believe we need to offer the higher segment of bundles. But if your expensive product is used in lower utilization environments, then the cost of downtime to its owner is lower, resulting in less budget for mitigating strategies. That unit may end up with a bronze contract.

If we want to address the challenge of more vocal and demanding customers, we need to flip the bundling paradigm from product to usage characteristics. To understand those usage characteristics we need to have a mitigating strategy conversation with the owner/user of the product.

Mitigating Strategy Conversation

Dear buyer, why is my product so important to you, and what happens if my product fails? What impact does downtime have on your operations?

If your customer is buying your product, meaning there is a point of title passage, it implies that all risks associated with owning the product reside with your customer. As a product owner, your customer will define a mitigating strategy for uptime/downtime risks throughout the life cycle of the product. As OEM you can help the product owner by offering life cycle services. The owner will weigh risk versus price.

Dear buyer, do you agree with me that throughout the life cycle of the product you will need the following service activities to maintain and safeguard the uptime of the product? Which of those activities do you want to execute yourself and which ones do you want me to do?

Is the Service Menu Card is Replacing Bronze, Silver and Gold Contracts?

The above picture a derived from the ITIL v4 framework by Axelos. All boxes serve the nominal state of the product, the uptime. And uptime ensures the output and outcome of the product. If your customer agrees with this landscape of services, the conversation becomes a simple one: what level of risk does the owner/buyer want to retain, versus outsourcing that risk to a service provider in exchange for a fee.

Driving Business Results with Entitlement Process

Flipping the service bundle paradigm and handing over the choice to your customer may sound scary. Is it controllable? With modern-day field service management software the answer is yes. It’s similar to going to a restaurant. You define what is on the menu. Your customer has the choice. And any good chef knows that the personal interaction at the table when ordering is key to the choices made. The success of CSAT starts when ordering.

With modern tools, you can implement a service menu card in the service-sales process. The true value comes from pairing the menu card with an entitlement engine in your service delivery process. It’s great that you sold all those configure-to-order service contracts to meet customer requirements. The people that have to deliver the services need to be aware of what has been promised, what has been paid for, and what is billable. This is where the entitlement engine kicks in.

A sophisticated entitlement engine has visibility on the customer, the asset, the contractual obligations agreements, and on the specifics of the customer-ask as specified in the case or work order. As ‘gatekeeper’ the entitlement engine will drive:

  • Customer expectation & satisfaction
  • Leakage reduction
  • Cross & Upsell increase
Is the Service Menu Card is Replacing Bronze, Silver and Gold Contracts?

To accommodate vocal and demanding customers a service menu card is a good alternative to bronze, silver, and gold bundles. Having choice and autonomy creates engagement and builds the foundation to success and CSAT.

To stay in the restaurant analogy, the proof is in eating the pudding. Your service delivery organization needs to have insight into what has been sold/ promised and be able to act on it. Imagine the waiter bringing the food without knowing the order. No tip, invoice at risk, no return visit.

The service menu card and the entitlement engine go hand-in-hand. Say what you do then do what you say.

Learn more about service contracts & entitlements from ServiceMax here. 

This article is published in ServiceMax Field Service Digital on October 21st, 2021

Asset Data Remains Largely Untapped For Driving Revenue Growth

New study finds asset equipment data is key to bridging the gap between sales and service

PLEASANTON, CALIFORNIA – October 19, 2021 – Valuable data collected from servicing equipment assets remains largely untapped, unused and under monetized, offering rich potential to sales and marketing, according to new research conducted by WBRin collaboration with ServiceMax, Inc., a leader in asset-centric, Field Service Management software and Salesforce, the global leader in CRM.

The study, “Building a Bridge Between Sales and Service with Asset Data”, surveyed 100 field service leaders across the US and Canada from a variety of verticals, including manufacturing, information and communications technology, the semiconductor industry and utility sectors.

While all the organizations surveyed currently aggregate and analyze data from their field service operations, only 22 percent trust their field service data completely, indicating lack of confidence in their existing systems or procedures. And more than one-third of respondents can’t connect their field service management solution with their CRM. As a result, organizations are missing opportunities to provide better service to their clients and generate new revenue streams by monetizing data, such as personalizing marketing campaigns, driving more revenue from usage insights and analytics and demonstrating ROI in sales conversations.

While asset data remains largely under-used at present, the study also revealed that almost half of respondents (44 percent) plan to adopt or update their asset data analysis solutions in the next 12 months —including remote and virtual service support tools, asset data analysis solutions, IoT devices and sensors, and others. Likewise, at present, only 27 percent are currently utilizing their field service solutions for field service analytics, while in the next 12 months, 57 percent will deploy this capability.

“The research shows growing recognition and demand for closing the asset data gap,” said Amit Jain, Chief Product Officer for ServiceMax. “This gap exists between an organization’s current service revenue and the maximum revenue it could achieve when every unit sold could have a higher service contract attached to it. By using field data to optimize revenue and drive product innovation, product, service, sales and marketing organizations can maximize their asset performance. This critical insight is relatively new and empowers service leaders to easily shift to outcome-based business strategies that fuel growth in an age where service is now a differentiator.”

The research also found that 43 percent of organizations admit they need to improve their asset uptime and availability, lending further weight to the need for better service data and service delivery.

The full report can be downloaded here.

Salesforce and others are among the trademarks of salesforce.com, inc.

About ServiceMax

ServiceMax’s mission is to help customers keep the world running with asset-centric field service management software. As a recognized leader in this space, ServiceMax’s mobile apps and cloud-based software provide a complete view of assets to field service teams. By optimizing field service operations, customers across all industries can better manage the complexities of service, support faster growth, and run more profitable, outcome-centric businesses. www.servicemax.com

Media Contact:

Nicole Guzzo
nicole.guzzo@servicemax.com

How to Use Service Marketing to Grow Service Revenue

Over the last five to ten years, a growing number of Chief Service Officers (CSOs) have been assigned a service revenue growth target—a trend recently confirmed through research by Noventum, which found that more than 85% of product manufacturers have set a growth target for their service function. As this trend gains steam, we think it’s worth examining how CSOs can achieve service revenue growth and what they can learn from the sales side.

If you ask a salesperson to grow revenue, they will ask for two prerequisites:

  • More and newer products with more features at a better price point
  • A marketing budget to target the addressable market

What does a CSO ask for when receiving and accepting a service revenue growth target? For many CSO’s, growing service revenue and using service marketing is unchartered territory.

What’s your marketing budget?

Up to 2012, I managed my service operations at Bosch as a cost center. At that time service was the single largest margin contributor to the company. In 2012, I received service revenue growth objectives. Simultaneously my role transitioned from the service domain to the sales domain. In my first conversation with the chief revenue officer, I was asked: “What marketing budget do you need?”

Having run service operations for 25 years, my automatic response was to first focus on achieving excellence for the existing service delivery capabilities. After a crash course in sales and marketing, I revised my strategy. Sell first. Secure the revenue. Use the revenue to finance the maturing of your delivery capabilities.

The result: a quadrupling of service revenue in five years. How? By focusing on two items:

  1. Using the voice of the customer to develop a services portfolio
  2. Setting up service marketing for the installed base

Developing a services portfolio

Back in 2012, I was so focused on service delivery, it never crossed my mind to challenge my services portfolio. My sales colleagues explained to me that a portfolio with sufficient choice is the basis for revenue generation. We then set on a course to create a services portfolio with selectable features and differing price points. Our goal was to create an “a la carte” menu card.

The true test was to come. Would our customers buy the items from our menu card? This is where we realized our need for a true marketing function. A function to help us frame the value messaging and to reach out to the target audience.

Setting up service marketing

First, we looked at the value promise our company made to its customers. Is that value promise pertaining to owning the product and/or is it about using the product throughout its lifecycle? How does our menu card of lifecycle services fit in? And how do we facilitate product owners in making the right service lifecycle choices?

In setting up a marketing function for service, we used our sales colleagues as reference. In the world of sales, key metrics are Total Addressable Market (TAM) and Market Share. Marketing uses these two parameters to spearhead campaigns. In the world of service, these two metrics can be substituted by Installed Base penetration and Attach Rates.

Total addressable market

Suppose you have installed base visibility of 100% and all those units have an attached service contract. Suppose all those contracts are of the type gold-service. The sum of that equation is your maximum achievable service revenue. You could label this as your service-TAM. If your organization also services units of competing brands, the service-TAM will be bigger.

Market share

Your current actual service revenue is the compound result of two factors – your ability to drive installed base visibility and attach rates, in combination with the attractiveness of your services portfolio.

The gap

As mentioned in an earlier blog Mind the Gap, the delta between your service-TAM and your actual market share is your revenue gap. This gap encompasses your target audience for service marketing. The larger the gap, the bigger your compelling reason to review your services portfolio and to establish a service marketing function.

Targeting your audience

Service marketing has one big advantage over sales marketing: with a field service management system focused on asset-centric business models, marketing will have the perfect data set to drive targeted campaigns:

  • Knowing where your installed base is
  • Knowing the state of the asset and how the asset is being used
  • Having a record of the maintenance history
  • Knowing what engineering change orders and modernizations have been implemented
  • Visibility to the current service contract and entitlements

As one of our customers told us:

“We operated a model of sell and forget. Now we sell and service. We have invested in installed base visibility, attach rates, our services portfolio and service marketing. We are now on a deliberate and conscious path of service revenue growth.”

Setting a budget

Knowing what I know now, I would respond differently to my former chief revenue officer. I would request a service marketing budget to revisit my services portfolio and to initiate targeted marketing on my revenue gap.

I would not hesitate to commit to service revenue growth targets, knowing the service delivery organization had an asset-centric field service management system.

This article is published in ServiceMax Field Service Digital on August 25th, 2021

Using trigger points to manage your service business

Sometimes it feels like being a jack of all trades when managing a service business. On the one hand you act like a firefighter, on the other hand you know service is strategic to your business’s future earnings. That said, how do you elevate your job from the reactive to the proactive? Establishing trigger points may be the key ingredient to manage your business on an 80/20 basis. Thus, giving you the focus on interventions that matter.

Define success

When do you know you are doing a great job? In speaking to many service executives, it is not always clear what the norm is. “We want to increase service revenue by 20%”. Why 20%? Why not more? Why not less? In my blog Mind the Gap I tried to establish a norm for a maximum service revenue. In a blog by Shawn LaRocco he defined a norm for Cost to Serve. Both blogs have in common that success is put in a perspective of a norm.

Triggering the outliers

A facilities management customer of ours is processing 15,000 – 20,000 workorders per month. In the past they had a team of 30+ people in the back office validating and correcting all debriefed work orders. Based on gut feeling and experience there was a belief that 80% of the work orders did close within a bandwidth of ±5% of expectation. By formalising that bandwidth through trigger points, they now have a tool to filter the volume and start managing by exception.

Timely intervention

Apart from managing your workload on a 80/20 basis, trigger points serve as an early-warning system allowing for timely intervention. You don’t want to pay penalty cost for a missed SLA. Instead, you want a service job to be flagged if its progress jeopardises SLA attainment. E.g., a break-fix job needs to be completed within 4 hours. After 3 hours you could ping the technician to ask if completion is still on track. If not, you could provide the technician with support and/or contact the customer with a heads up.

A trigger point is thus a floor or ceiling boundary on a metric triggering an event. Using workflow, you can route the event to the mitigating personas in your organisation.

Value = Result minus Expectation

Many years ago, the value of trigger points was eloquently explained to me by university professor Meindert Flikkema. He stated that every event has both an expectation and a result. If somebody gets more than expected, then that person is happy … and vice versa.

In the context of running my own service organisation at Bosch I tweaked Meindert’s equation and added the concept of a bandwidth around expectation. Similar to the above example of ±5%, I strived to manage my operations inside the bandwidth. Inside the bandwidth I let the business run on automations. If I managed well, that would account for 80% of my workload. The outliers I routed to my attention queue. Over time trigger points would help me focus on what really matters for both my customers and my CFO. I’ll use the business driver contract profitability to illustrate the value equation and its impact.

Contract profitability in action

Suppose a customer wants to buy a full-service contract with a scope-of-work containing preventive maintenance, capped break-fix events, calibrations, software maintenance and an included set of spare parts and consumables. Using a CPQ-like tool the scope-of-work totals to a calculated cost of $75,000, a calculated revenue of $100,000 and an expected margin of 25%.

Throughout the lifecycle of the contract executed service activities will impact the cost you accrue. If those cost exceed the $75,000 you have either over-delivered or over-run on your calculated cost. Your CFO will see a less-than-expected margin contribution. If your margin is significantly more than the expected 25%, then either you are over-charging or under-delivering. Your customer may get a feeling he/she is not getting value for money. 

Tipping the trigger level should make you curious. Challenge both expectation and result. Do you have a clear understanding of cost-to-serve? Are you taking the life cycle of the product into account? Did the product owner accept your mid-life-upgrade proposal?

Pro-active

As service leader you don’t want to be told about under or over-situations by your CFO when it is too late for corrective intervention. Similarly, you don’t want you customers to churn. Trigger levels act as an early-warning system before you accrue irreversible cost or impact customer expectation negatively.

  • It’s November. Show me all contracts at 80% of calculated cost. Let’s see what service activities we can push out to ‘save’ this years’ margin contribution.
  • It’s July. We anticipated six break-fix events for a full year. We’ve already had four. We want to flag future break-fix service requests to inform the customer service agent and technician to be stricter.
  • It’s September. The year-to-date contract margin spikes at 35%. Upon investigation you find that a contracted and scheduled calibration activity has been cancelled by the customer. Instead of treating this as easy money, you engage with your customer to pre-empt contract renewal conversations.

Managing intelligent

As long as we have unplanned downtime, firefighting will remain an element of a service leaders’ job. Service execution tools are a great help to facilitate the transaction and collect service data. The true value manifests itself when you use transactional data in combination with trigger levels. Trigger levels give you that early-warning to become pro-active instead of reactive. Trigger levels add direction to your decision making. And better decision making makes you more intelligent and more strategic. Not only inside the service domain, but across your organisation.

This article is published in ServiceMax Field Service Digital on July 27th, 2021

Why Are Sales Leaders Taking Over Service?

For a couple of years now, I’ve been writing about the convergence of Sales and Service. Service, with all its touchpoints during the operational life cycle of a product, has a tremendous capacity for value creation. To reap that value, Service needs a little more Sales DNA. Likewise, Sales needs a little more heart for Service. With a shift from revenue contribution to margin contribution, we see Sales ‘taking over’ the Service Revenue agenda.

You Now Report into Sales

A true story. I’ve had extensive experience running service departments. In all those years my main objectives were focused on service delivery and operational excellence. Over time, I saw an increased interest in service margin and service revenue. When my former organization updated my business objectives with a service revenue target, that goal came as part of a package deal: “you now report into Sales.”

Initially, I did not understand how reporting into Service or Sales when having a service revenue target would make a difference. At that time, the prevailing current was that revenue generation was the prerogative of Sales. Service was seen as a delivery engine focussed on operational gain.

Over the years, I’ve witnessed a dynamic between Sales and Service when it comes to the ‘claiming’ of business case benefits. Lately, a CEO put the reasoning into works while we presented the business benefits of a digital and service transformation project to his executive team. The CEO attributed productivity and cost savings to operations and service. He associated revenue targets with sales. When our business case showed significant revenue benefits through improving installed base visibility and attach rates, sales were the first to claim credits and ownership. For sales, these two improvements translate into touchpoints and conversion. This duo is the bread-and-butter of the sales process.

Bridging Sales and Service

Though sales leaders may be taking over the revenue growth agenda, we all know there is a huge difference between selling products and selling services. The engagement model is different. The buyer role is different. The appraisal of Capex versus Opex has a different impact on decision-making, etc. Most of all, it’s a simple numbers game. Sales revenue is big numbers, service revenue is smaller numbers: Guess who will be seen as the hero?

Any CFO can tell you that services, despite carrying a lower revenue amount, often have a significantly higher margin contribution. What if we were to start incentivizing salespeople with a margin contribution target rather than a revenue target? Great idea? Too radical? Maybe such a move could swing the pendulum in the opposite direction. If all your salespeople were selling services, you would forget you need an initial product sale to make the model work.

So we are back to an earlier blog post I wrote about the importance of Sales and Service Working in Collaboration. The initial product sale is like an ‘entry ticket’ to selling adjacent services. Using the analogy of a theme park, say Universal Studios or Legoland, once you are inside and start spending money, that’s where the EBIT is made. It is the achievement of ticket sales to get you inside. It is the effort of the entertainers to keep you inside as long as possible…and spend money. Are both roles different? Yes. Is one role more important than the other? No.

Building a Portfolio of Lifecycle Revenue Generators

We can transpose the analogy of a theme park to the world products and services by illustrating two common situations:

  • Product sales over-promises: Making it hard(er) for service to sell attached services. In effect, you’re trading high-margin contribution activities for a lower margin contribution.
  • Services portfolio not appealing enough: Making it hard(er) to generate service revenue and providing customers with reasons to churn.

Both examples should compel any product/services company to rethink their revenue generation and margin contribution ‘building blocks.

More and more sales leaders are understanding that revenue generation spans the entire lifecycle of the sold product. The realization that the post-sales value proposition has a symbiotic relationship with the pre-sales value proposition, triggers sales leaders to claim control of the services portfolio and the lifecycle go-to-market strategy.

Now you are thinking: is this the job description of a Chief Revenue Officer (CRO)? Yes, you are close. When a buyer applies a concept like total cost of ownership (TCO) in weighing a purchase, then the response on the sales side converges in the responsibilities of a CRO.

Is it bad for Service when Sales leaders are taking over? I believe not. I think Sales and Service have different but complementary skills to drive the revenue growth agenda. Sales DNA finds Service Heart!

This article is published in Diginomica on June 9th, 2021 and ServiceMax Field Service Digital on June 17th, 2021

Frontline Revenue: Take Your Field Service Lead Program to the Next Level

Co-author: Sumair Dutta

In our first article, we discussed tactics for getting technicians onboard with the idea of selling. While technician lead generation programs don’t involve a big investment in technology, they do require change management and training. Once technicians are ready to extend their role as trusted advisors into recommending and quoting new products and services, how do you ensure they do a great job and stick with it?

Follow these five tips to accelerate your technician lead generation program.

1. Don’t Make Your Technicians Chase Their Leads

As noted in the first article, the black hole of lead follow-up can be a major failure point in lead generation programs. If a technician submits a lead, they shouldn’t have to chase the responsible parties on follow-up status. This is particularly true if the lead is tied to an actual conversation with or recommendation made to the customer thereby implying that the technician’s reputation is at stake. Technicians don’t need to see every lead be successful, they just need to know that their effort is being followed up on and this can be done effectively via improved communication or opportunity tracking tools.

2. Push for Sales Accountability

The monetary value of a service lead might not compare with that of a regular sales opportunity. This might be enough to detract salespeople from following up on service-generated leads. Therefore, it’s essential that sales leadership is bought into driving accountability for a service lead program. An easy way to do this is to show the impact that top-performing regions or districts are having when it comes to top-line revenue. If sales isn’t motivated by that performance, business leadership will be.

3. Compensation – Make it Timely

Most organizations develop a financial reward system for field service technicians based on leads closed. Some offer incentives for the volume of leads generated. The issue is that most programs stop here. While the field technician cares about the amount of recognition received, they care more about getting recognized quickly and painlessly. They shouldn’t have to fight for the recognition or have to wait for it for a considerable amount of time. Therefore, it’s essential that the reward system developed, monetary or otherwise, is efficient enough to deliver the reward to the field technician in an expedited manner.

4. Keep an Eye on Activity-Based Metrics

Activity drives results and it is essential to track activity-based metrics as leading indicators of program success. These metrics could include participation rates, referrals per technician, and average cycle or follow-up time for leads. Organizations might also want to consider a technician confidence index or survey to measure the health of their lead program. Such a survey would measure how confident the technicians are in their ability to get paid on leads. The higher the confidence, the greater the activity.

5. Leverage Your Top Performers to Drive Increased Interest

Some organizations consider lead scoreboards to gamify lead generation. In most instances, top-performing technicians or branches are identified in terms of activity and business impact. The true impact of these scoreboards is uncertain as this is tied to your organization’s culture and the mindset of the technicians. That said, it is effective to have your top performers share their success stories and best practices with other technicians. Not only is the content useful and valuable for the other technicians but it also comes from a party that they trust.

Our Global Customer Transformation team is happy to learn more about your program and offer insight and knowledge on where it can be strengthened.

This article is published in ServiceMax Field Service Digital on June 10th, 2021