How to Use Service Marketing to Grow Service Revenue

Over the last five to ten years, a growing number of Chief Service Officers (CSOs) have been assigned a service revenue growth target—a trend recently confirmed through research by Noventum, which found that more than 85% of product manufacturers have set a growth target for their service function. As this trend gains steam, we think it’s worth examining how CSOs can achieve service revenue growth and what they can learn from the sales side.

If you ask a salesperson to grow revenue, they will ask for two prerequisites:

  • More and newer products with more features at a better price point
  • A marketing budget to target the addressable market

What does a CSO ask for when receiving and accepting a service revenue growth target? For many CSO’s, growing service revenue and using service marketing is unchartered territory.

What’s your marketing budget?

Up to 2012, I managed my service operations at Bosch as a cost center. At that time service was the single largest margin contributor to the company. In 2012, I received service revenue growth objectives. Simultaneously my role transitioned from the service domain to the sales domain. In my first conversation with the chief revenue officer, I was asked: “What marketing budget do you need?”

Having run service operations for 25 years, my automatic response was to first focus on achieving excellence for the existing service delivery capabilities. After a crash course in sales and marketing, I revised my strategy. Sell first. Secure the revenue. Use the revenue to finance the maturing of your delivery capabilities.

The result: a quadrupling of service revenue in five years. How? By focusing on two items:

  1. Using the voice of the customer to develop a services portfolio
  2. Setting up service marketing for the installed base

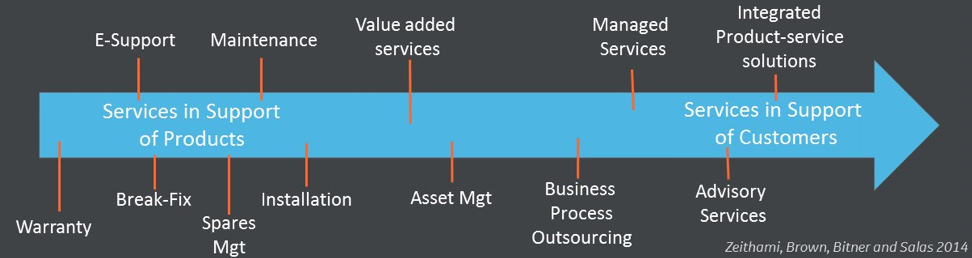
Developing a services portfolio

Back in 2012, I was so focused on service delivery, it never crossed my mind to challenge my services portfolio. My sales colleagues explained to me that a portfolio with sufficient choice is the basis for revenue generation. We then set on a course to create a services portfolio with selectable features and differing price points. Our goal was to create an “a la carte” menu card.

The true test was to come. Would our customers buy the items from our menu card? This is where we realized our need for a true marketing function. A function to help us frame the value messaging and to reach out to the target audience.

Setting up service marketing

First, we looked at the value promise our company made to its customers. Is that value promise pertaining to owning the product and/or is it about using the product throughout its lifecycle? How does our menu card of lifecycle services fit in? And how do we facilitate product owners in making the right service lifecycle choices?

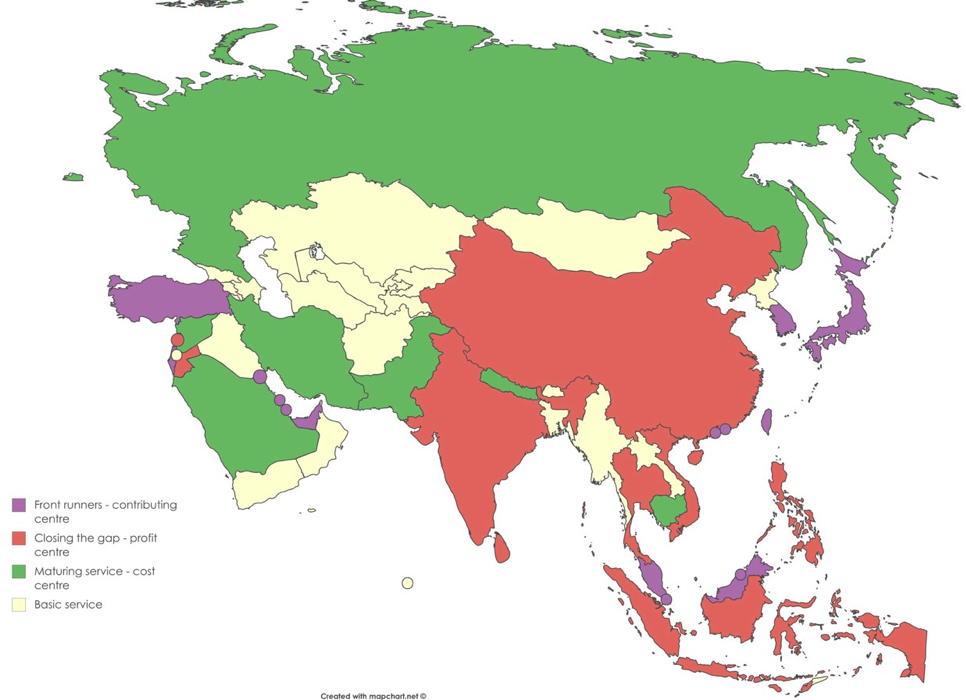
In setting up a marketing function for service, we used our sales colleagues as reference. In the world of sales, key metrics are Total Addressable Market (TAM) and Market Share. Marketing uses these two parameters to spearhead campaigns. In the world of service, these two metrics can be substituted by Installed Base penetration and Attach Rates.

Total addressable market

Suppose you have installed base visibility of 100% and all those units have an attached service contract. Suppose all those contracts are of the type gold-service. The sum of that equation is your maximum achievable service revenue. You could label this as your service-TAM. If your organization also services units of competing brands, the service-TAM will be bigger.

Market share

Your current actual service revenue is the compound result of two factors – your ability to drive installed base visibility and attach rates, in combination with the attractiveness of your services portfolio.

The gap

As mentioned in an earlier blog Mind the Gap, the delta between your service-TAM and your actual market share is your revenue gap. This gap encompasses your target audience for service marketing. The larger the gap, the bigger your compelling reason to review your services portfolio and to establish a service marketing function.

Targeting your audience

Service marketing has one big advantage over sales marketing: with a field service management system focused on asset-centric business models, marketing will have the perfect data set to drive targeted campaigns:

  • Knowing where your installed base is
  • Knowing the state of the asset and how the asset is being used
  • Having a record of the maintenance history
  • Knowing what engineering change orders and modernizations have been implemented
  • Visibility to the current service contract and entitlements

As one of our customers told us:

“We operated a model of sell and forget. Now we sell and service. We have invested in installed base visibility, attach rates, our services portfolio and service marketing. We are now on a deliberate and conscious path of service revenue growth.”

Setting a budget

Knowing what I know now, I would respond differently to my former chief revenue officer. I would request a service marketing budget to revisit my services portfolio and to initiate targeted marketing on my revenue gap.

I would not hesitate to commit to service revenue growth targets, knowing the service delivery organization had an asset-centric field service management system.

This article is published in ServiceMax Field Service Digital on August 25th, 2021

Back to the Future with Design-for-Service

Yes, it’s really happening!”. That was my feeling when a customer of ServiceMax contacted me to enlighten them on the Design-for-Service concept. Six years ago, they started their service transformation journey to get Visibility and Control. Now they are moving the needle towards Excellence and Growth. What makes this ask even more ‘special’, is that it is the engineering department that wants to know what service needs to deliver value.

Black swan

Most of us will have plenty of examples where engineering asks technicians to record all kind of diagnostics, reason and fault codes during the service execution. What happens with that data? Will the technician feel taken seriously when servicing yet another piece of equipment that is engineered for manufacturing?

Thus, you can imagine my positive surprise when engineering wants to ‘learn’ what service needs and what modern service execution tools are capable of. It is a true win-win when both service and engineering are seeking the joint benefit of their siloed effort. 

  1. Technicians will get a return on their administrative effort when they see that it results in easier-to-maintain products.
  2. Engineering will get the justification to fund their design-for-service effort when they see that service can improve the margin and drive new revenue streams.

Attach Rates

The concept of design-for-service is not new. Still many organisations only apply design-for-manufacturing. The latter concept drives for cost optimisation in the manufacturing process of a product at the expense of a potential higher maintenance cost over the life cycle of the product. Design-for-service optimises both the manufacturing and the maintenance aspects of a product. Yes, I hear you. What about TCO, total cost of ownership? TCO is great, but TCO only works when capital expenditures (Capex) and operating expenses (Opex) are evaluated by a single entity.

Cutting a few corners and dialling it down into a single metric, have a look at your Attach Rates. You can imagine that when engineering puts more effort/ cost into the design of the product, the selling price of the product goes up. Balancing the effort equation, you have the maintenance cost going down due to better quality and more efficient maintenance delivery. On top of that, the engineering effort may also result in the creation of new types of service offerings like availability services and data-monetisation. To reap the benefits post point of sales, you need to have or get your customer ‘attached’.

Attach Rate: the percentage of your installed base that has an associated service contract with your organisation

Getting ‘attached’ customers might be easier when you sell your product via your own direct sales channel versus units sold via your indirect channel, read dealers and resellers. That all changes when engineering starts including concepts like ‘digital activation’ of the product.

Serviceability

When engineering defines the Product, the result is captured in a BOM (Bill of Material). So far, nothing new, this is design-for-manufacturing 101. When we start designing-for-service, we need to make a number of explicit decisions. Amongst those I’m highlighting two of them:

  1. What components from the BOM are serviceable?
  2. What service delivery model is applicable for that component?

First, is the product serviceable at all? If it remains a single unit, you have made the implicit choice to exchange the whole unit with the option to have the defect unit repaired or scrapped at a depot. This model may be a fit for some products but the larger, expensive and critical the product, the more you’ll need to ‘open the box’.

Second, in the BOM you’ll have to identify those components that are serviceable. For each component in the Service-BOM or SPL (Spare Parts List) you’ll have to classify the part.

  1. FRU: Field Replaceable Unit – the repair/ replace of the component requires specialised skills of a technician
  2. CRU: Customer Replaceable Unit – the repair/ replace of the component can be done by any customer (no explicit skills required)
  3. DRU: Depot Repairable Unit – the repair cannot be done in the field, but requires the asset to come to a depot where dedicated skills, tooling and components are available

Old-school textbook?

I’ve come to learn the above two service design considerations when I stumbled into my first service job at IBM in 1993. Though I did not grasp the full impact at first, the more I talk to today’s customers, the more I am convinced we need to re-establish the handshake with engineering to deliver above and beyond the service value promise. 

Handshake

In my session with this customer, I had conversation with a very adept, eager and forward-looking engineer. He understood the consequences of engineering choices for the service delivery … and ultimately the impact to cost, revenue and customer expectation.

Next, he wanted to know how service delivery constraints and possibilities would impact his engineering process. It was clear to him that state-of-the-art service execution tooling, with a high degree of asset centricity would enable him to create a positive ROI for his design-for-service efforts.

This article is published in ServiceMax Field Service Digital on December 10th, 2020

Finding Revenue Leakage in your Service Business – part 2

Do you know what your maximum service revenue potential could be based on the product units your organisation sells? Is your current service revenue less than this maximum? And, do you have a process to upsell service contracts into your existing installed base? One or more puzzled looks, chances are big you are suffering from Upsell-leakage. 

In the previous episode we have defined two types of leakage; Contract and Non-Contract leakage. In this episode we’ll define Upsell-leakage. Most likely upsell leakage will be twice as big as the other two combined.

Upsell leakage

As service organisation you’d like all your customers to buy your premium service. Some customers will buy ‘gold’ service level for their installed base, others will be happy with ‘basic’ service. It all depends on the use case of your customer and their propensity to value the services you offer. As use cases tend to change over time, you may want to consider setting up an upselling program using the touch points from your service delivery. 

If you don’t ask, you don’t give them the opportunity to say yes

Not having such a programme deprives you of revenue potential; being the delta between your current service revenue and ’gold’ service level.

Defining the upsell service revenue potential

To quantify upsell leakage we can use a mechanism known to Sales as TAM (Total Addressable Market). Suppose you sold 1,000 units at $10,000 each. Suppose a ‘gold’ service contract has an annual selling price of 12% of the unit selling price. This would put your service-TAM at $1,200,000 per annum.

Imagine your service department has 600 of those 1,000 units on their radar screen. The rest is sold via an indirect sales channel and/ or lost-out-of-sight. This gives an installed base visibility of 60%. Let’s assume those 600 units generate a service revenue of $400,000, split across:

  • 10% of units are in (OEM) warranty and don’t generate revenue (yet)
  • 50% of units have a bronze, silver or gold contract generating $240,000
  • 40% of units don’t have a contract and generate $160,000 in Time & Material (T&M)

With the above figures you currently reap 33% of your service-TAM and you have an upsell potential of $800,000. Monitoring this upsell leakage metric should give you the incentive to put a revenue generation program in place.

Metrics driving upsell leakage

In the numeric example we’ve touched on three metrics that impact and drive upsell leakage.

  • Installed base visibility: it all begins with installed base visibility. Units not on your radar screen will not contribute to your service revenue! This is easier to manage for units sold via your organisation’s direct sales channel, though it does require an effort to manage the life cycle from as-sold to as-maintained. For units sold via the indirect sales channel you’ll have to exert extra effort to get access point-of-sale data, maybe even ‘buying’ the data.
  • Attach rates: both warranty and contracts are attached to the unit, thus driving attach rates. Attach rates are ‘boolean’, they say something about having an attached contract, not about the amount of revenue you get through that contract. Attach rates start at the installation/ commissioning date of a unit. Either Sales makes the attached-sale at point-of-sale of the unit or the Service department drives the attaching post-point-of-sale. Driving metric for Service is to maintain a continuum of attachment throughout the life cycle of the unit. 
  • Service revenue contribution: Within the subset of attached contracts you’d like to have as much revenue contribution as possible, ‘gold’ service being the holy grail. Per service contract you could have any of the following revenue contributions:
    • OEM Warranty: 0% of Service-TAM
    • Enhanced Warranty: 33% of Service-TAM (only the on-top-of OEM warranty piece)
    • Extended Warranty or Basic service: 67% of Service-TAM
    • Gold: 100% of Service-TAM

In terms of merchandise, you can’t force anyone to buy something

Remedying upsell leakage

The overarching paradigm to growing service revenue is twofold: increasing your installed base visibility and making sure you have attached offerings to those units. 

Getting visibility on units sold via the indirect channel is slightly more complicated, but once you quantify the associated service-TAM with those units, you may have the ‘funding’ to ‘buy’ the data. This may even lead to revenue sharing models with your channel partners.

The last piece of the puzzle is using the visibility of the upsell leakage gap whenever you have a touch point with your customer. Note that the original (service) contract has been drafted many months ago by people whom are further away from the business, who could not 100% envision the service reality of today. You thus may end up in an entitlement conversation where the customer has an urgent requirement whereas the contract ‘only’ covers for the ‘basics’. The delta is an upsell opportunity. Either resulting in an upgrade of the service contract or maybe only upgrading an incidental work order. In case the latter happens more often, you have the data points to convince the customer for the former.

Now, understanding that upsell leakage is potentially twice as big as contract and non-contract leakage together, you may have found your compelling reason to start another revenue growth project.

This article is published in ServiceMax Field Service Digital on November 19th, 2020 and Field Service News on Jun1 1st, 2021

Finding Revenue Leakage in your Service Business – part 1

Have you ever had to Credit or Discount an invoice? If the answer is ‘yes’ then you have leakage, if the answer is ‘no’ then you definitely have leakage.

How do you respond to the Aberdeen finding that best-in-class companies have a whopping 14% warranty & contract leakage? Denial, absurd, overstated, or … wait-a-minute, maybe I’m not looking at the right KPIs to detect leakage. Once you acknowledge leakage exists in your organisation, wouldn’t you go all the way to manage leakage out of your business, knowing it has a direct impact on your bottom line?

Defining leakage

What is service leakage? In the simplest terminology: you are losing money. And the bad news is that it often happens without you knowing or realising it.

We can distinguish two types of service leakage:

  1. Non-Contract leakage : the periods in the operational life cycle of an asset not covered by warranty and/or a service contract (sometimes this is also called T&M-leakage because service outside a contract classifies as T&M).
  2. Contract leakage: an asset is covered by warranty and/ or a service contract but in your service delivery you provide more and/or a higher level of service than the customer is entitled to. 

Contract leakage typically occurs when service organisations do not know and/or manage expiration dates of warranty and contracts. Non-contract leakage typically occurs when the entitlement process is fragmented and/ or when the information is not accessible to all involved service actors.

Let’s mention a couple of common scenarios:

  • A customer claims a defect within the warranty period. You correctly entitle the job as ‘warranty’. On site the technician detects ‘customer induced damage’. The technician performs the repair anyhow and there is no charge to the customer.
  • A customer is entitled to next day service but presses you to fix the machine today without paying an additional fee. Because your technicians are not busy today, you give in to the request.
  • A customer makes a service request assuming the current contract is still active. Upon entitlement check you detect it has expired three months ago. The customer agrees to renew the contract per current date. You incur 3 months loss in contract revenue.
  • A customer has multiple machines of the same model. Only one of them is covered by a contract. The single contract line is used to entitle work on all of them because the customer always uses the same serial number.

Service Leaks are not the problem; they are the symptom. They reveal a disconnect between process design and actual behaviour. Denial of leakage increases the disconnect.

Impact of leakage

One of the unfortunate things in business is that the cost always hits you – now, if you are so good at capturing cost why do you allow revenue to slip through your fingers? How do you think your shareholders would enjoy hearing that you worked on a customer’s asset and neglected to bill them? 

Another way to look at the impact of leakage is to establish how much extra revenue would need to found above and beyond what you are already billing for. Let me paint a picture for you, as we have established you capture all of your costs so any leakage (missed revenue) that you capture will have a 100% positive impact to your bottom line – every dollar billed will be a full dollar of equivalent gross margin. So, let’s say you were running at 20% margin as a service organisation and you allowed $100,000 to leak through your service organisation, now a service org would need to go and find $500,000 of brand spanking new business to offset this $100,000 leakage just to break even. How hard is it for a business to find $500,000 of extra revenue with the same resources? 

Actually, quite easy – set your system up to minimise the risk of leakage….

On top of the cost, revenue and margin contribution impacts, customer expectation is a big one. Leakage has a very large behavioural component. If a customer is used to getting service for free, it becomes very difficult to start charging for it. If a customer ‘discovers’ you can’t manage your entitlements correctly, this may lead to ‘unwanted’ service calls.

A similar behavioural impact can be expected on the technician’s end. A technician chose his job because he/she wants to fix things and be a hero on site. A technician did not select the job to do admin and become a contract-referee. Thus, if you do not empower your technicians with the right tools and information, do not expect any cost/revenue sensitivity, they will go for CSAT and please the customer.

Finding leakage

Do you find leakage or is it a matter of ‘capturing’ it? You are delivering all of the services that create the opportunity for leakage, so you already know where it is, you just need the correct tools to capture it, Oh and by the way,  they are never humans and excel… You need a robust process and a software solution to support that process and remove ‘chance’ from the equation. 

Detecting, quantifying and finding the origin of leakage in your organisation is a process like remedying a leaky roof. You’ll need adjacent ‘instruments’ to find the source.

Remedying leakage

The first step towards remedying leakage is accepting its existence. Once you have made leakage visible, you can start actioning it. And in general those actions fall into three categories:

  1. Stop delivering free service; this has a direct cost reduction benefit.
  2. Continue delivering ‘free’ service and start charging for it; this will increase both your revenue and your margin; the additional margin is 100% as we have shown you have already incurred the cost.
  3. Continue delivering ‘free’ service and use it as collateral for something else of value; this benefit is harder to manage, but we can argue it is good for CSAT and can be used during contract renewal to counter cost & rate reduction arguments from your customer.

This article is published in ServiceMax Field Service Digital on November 10th, 2020

Why Asset Centricity Matters

When you communicate with your garage to service your car, what is the first question they ask? Do they ask your name, or do they ask your license plate number? This is at the core of asset centricity. The asset is tracked throughout its life cycle to drive cost efficiency, revenue generation and customer satisfaction.

Know thy Installed Base

One of the first questions we ask to any organisation is what level of visibility they have on their installed base. Do you track your products/ equipment assets beyond point-of-sale?

The rationale is simple. If you want to be efficient in service delivery, you need to know where the asset are and in what state. If you want to drive revenue and satisfaction, you need to know how your customers are using the assets and why those assets are important to them in their operations.

If you don’t know your installed base, your actions will be ad hoc and be at the mercy of tribal knowledge of the people serving that customer.

Schneider Electric transformed their business model from ‘sell and forget” to “sell and service” growing their installed base visibility from 10% to 35% driving service revenue by 11% YoY.

<Insert link to Schneider customer reference>

Recognise the asset

You may know the customer, but if you don’t know the asset you may make the wrong decision. This is illustrated in the entitlement process. Entitlement is the gateway to cost control, revenue increase and customer satisfaction.

  • Leakage: provide service on an asset without warranty and/or contract
  • SLA attainment & CX: over/ underdeliver on customer expectation
  • Attach rates & revenue: miss an opportunity to cross and upsell
The role of Entitlement in Service Execution

Often, we hear organisations say that their knowledge about their assets is not yet at a level to perform a reliable entitlement process, resulting in a lot of corrective actions post work order debrief. Have a look at the Schneider electric video, collecting and validating asset data is a journey.

Tip: if by improving technician productivity the ‘saved’ time does not constitute an extra job per day, you can use the time to take inventory of the installed assets, its state and its surroundings.   

Know the asset

You might know the technical details of the assets you produce. Your maintenance manuals may prescribe what to do under nominal operating parameters. But what do you about how your customers are using the assets? Some may be ‘sweated’ and run at 99% of capacity. Others may be used occasionally only.

Having knowledge about how your assets are being used by your customers is an essential piece of information to define the right action. It will put the service request in context, help in the entitlement decision and support the triage process. It will give your customer the feeling that you’re providing contextual solutions.

Manage the asset

In the car example of the opening paragraph, the dealer focusses on the asset. The asset has a life cycle. In each phase of the life cycle different service and maintenance activities need to be executed … in combination with the usage profile of the asset.

The car may be purchased/ leased by owner A. After a number of years, the asset may transfer to owner B. If the maintenance history would be tied to the customer record, the data would be lost under ownership B. Thus, the reason why more and more organisations adopt asset centricity for life cycle continuity.

This continuity is extremely important in regulated industries. If any time in the life cycle a quality or compliance defect is detected in a series of assets, then you would like to have the opportunity to search an asset centric installed based, instead of sending messages to the owner who did the initial purchase of the asset.

Asset centricity allow you to manage your field change orders effectively. Asset centricity allows you to manage mid-life upgrades. Asset centricity is an equally powerful paradigm as customer centricity. Try to merge them into your business operations.

This article is published in ServiceMax Field Service Digital on April 14th, 2020

Driving Revenue Growth

Today most service executives have a revenue growth target. After having delivered cost reductions for decades, the switch to delivering revenue growth is easier said than done. Where cost control stays within the current paradigm, growing revenue requires an entrepreneurial mindset. 

When sales people need to grow revenue, their first response will be “Give me a new product, with more features at a better price point. And yes, we need a marketing budget too.” Let’s transpose this mindset to the service domain.

Give Me a New Product

Take a look at your current services portfolio. When is the last time you reviewed this portfolio? How did the services in your portfolio come to be? Was it an internal push or did you create a dialogue with your customer to develop these services?

Whether we use the word disruption or not, there are several changes to take into consideration. 

  • Customer behaviour 
  • Technology
  • Business objectives 

There are two significant trends we see at play today.

  1. From Product to Output to Outcome based services
  2. From Reactive and Preventive to Condition-based and Predictive services


Give Me More Features

At home you may have a lot of products laden with features you do not use. Those features have been added by the supplier to cater to a multitude of use-cases. You may have a comparable situation with the “features” on your services portfolio.

In growing revenue, the most important thing is to have a dialogue with your customer to change the feature push into a feature pull.

A preventive maintenance example:

You can split the preventive maintenance job into three pieces:

  1. The execution of preventive maintenance
  2. Creating a report on the findings and activities done
  3. Communicating about the job

Many customers see the execution of preventive maintenance becoming a commodity. They expect to get a report free of charge but will acknowledge its value increasing from a compliance point of view. The eye opener may be communication. When offering choices like email, telephone, video conference or communication on site, a growing group of customers will choose the latter. With equipment becoming so complex, customers want an expect to say something sensible about it. Often this visit turns out to be the largest cross and upselling opportunity.

We see two growth levers: 

  1. Suppliers adding communication “features” enter in a dialogue of value and drive new revenue streams
  2. Suppliers adding features enabled by service and digital transformation are more connected to their customers leading to more sustainable revenue

At a Better Price Point

We’ve heard various asset operators say: “Less service is more”. Meaning, the lesser a piece of equipment requires servicing, the more the operator can drive value from its use.

We also hear that OEMs providing basis break-fix and preventive maintenance services saying that these services are becoming commoditised and are under severe price pressure.

Of course, you should continue your efforts in improving your internal efficiency and curbing your cost, but the move forward is to develop services higher up in the value chain.

We see a shift:

  • From Price to Total Cost of Ownership (TCO) to Value based proposals


We Need a Marketing Budget

In Sales, growing revenue is driven by touch points, leads and conversion of those leads into a sale. In Service we have plenty of touch points and we are driven by customer satisfaction. 

  • We drive incremental sales while performing a maintenance job
  • We use customer satisfaction to the benefit of higher renewal rates attach rates post point-of-sales

Though these two actions do increase revenue, they build on existing customers in the service domain. To grow revenue further, you need to tap into a base beyond your existing service customers.

  • Sell services at time of product/ equipment sales
  • Sell services to adjacent and competitor equipment

To convince these “new” customers you need to be able to articulate how good and valuable your services are. Call it marketing.

This article is published in ServiceMax Field Service Digital on June 25th, 2018

Field Service Asia – Is Asia willing to pay for Service?

Sentosa Island was the backdrop for the first Field Service event in Asia. More than 120 delegates came to Singapore to participate in discussions and get a feel of the field service buzz. Many had heard their European or American colleagues talking about the US & EU editions and were encouraged to join the debate.

On the tip of the tongue was this one question: “Is the Asian customer willing to pay for Service?” Closely followed by “on a maturity scale, how do we compare?”

AsiaServiceMaturity

The two questions are interlinked. In the same country and sometimes with the same customer it makes a significant difference how you both define and position service. If service is more focused on the Product, the Asian customer is less inclined to pay for service. This is most visible in the Japanese culture where Product related service is pinned to Quality: if the product breaks, something is wrong with quality … and the supplier must fix it … at his cost.

FSAsiaAttendence

Despite all the cultural differences, most delegates agree that the basic field service business processes are more universal. A product breaks, the customer has an expectation and calls, the supplier fixes the product resulting in a customer satisfaction/ experience. For these service basics there is a lot of transformation going on. 

The transformation specifics unfold in building a business case. Three country specific attributes impact both the cost and the return:

  • Labor cost
  • Geographical spread and logistics capabilities/ cost
  • Local legislation, trade & sector barriers
ServicesScale

At the first Field Service event in Asia delegates have engaged with each other, thought leaders and field service tool providers. There is an overwhelming consensus on the value field service is providing to the organization and its customers. Going home, the promise of service transformation towards the future is even bigger. 

Adding the core message on “ownership” from the TEDx speaker Andrew Bryant, maybe we should rephrase the opening question: “When are we willing to pay for Service”. Make the question personal and dive into your own deliberations. If you can frame your service message more on the Customer side than on the Product side, I believe any customer will pay for Service.

This article is published in ServiceMax Field Service Digital on November 21st, 2017