How do you know you are making money on your service contracts?

In my previous life I sold service contracts for a large OEM. Like many service executives, I was proud of profit margins in the range of 40-60%. But when I talked to my CFO, the numbers didn’t compute in the bigger organisational picture. Let me take you on a narrative of planned versus actual contract profitability and how I gained control over my margin contribution.

Reactive margin contribution

It is still early in the new fiscal year. I have good hopes of making my numbers. Of course I know I have a few ‘high maintenance’ customers. At the same time I have a few ‘cash cow’ service contracts. They will balance out, I’m confident. 

Fast forwarding to the last quarter of the year. Am I still that confident? Obviously I have more insights into my year-to-date cost. Did everything pan out as expected? What options do I have in the remaing weeks of the year to make my numbers?

What I am trying to say. No matter how good my predictions and projections were, actual performance has a tendency to differ from planned performance. Maybe less on aggregate level, but certainly on individual customer or contract level. 

I want to speak the same language as my CFO to better align with the corporate agenda.

It was my ambition to be more in control. Not to depend on reactive and aggregate margin contribution, but to be proactive and predictive on individual customer/ contract level. 

Defining the selling price

When I started selling service contracts I had to brush up my sales 101. How do I define the seling price of my service contracts. I had three paradigms at my disposal.

  • Selling price = Cost plus Margin (aka Cost Plus)
  • Margin = Selling price minus Cost
  • Cost = Selling price minus Margin

If I had full visibility on cost and I had the upper hand in the commercials, then cost plus would work for me. My reality was that cost was more of a guesstimate. Rearding the margin, we had internal margin objectives. But in the commercial arena we often had to give in. This led to the acceptance of the second equation. Margin was not a driver but a result. Margin was reactive. 

Expanding on the narrative in the first paragraph: in the last quarter of the fiscal year the CFO would become vocal using the third equation. If the selling price was an unalterable fact and the margins were falling low, then only available option was to cut my cost.

I want to get ahead of the game to deliver predictable margin contribution.

Influence cost while you can

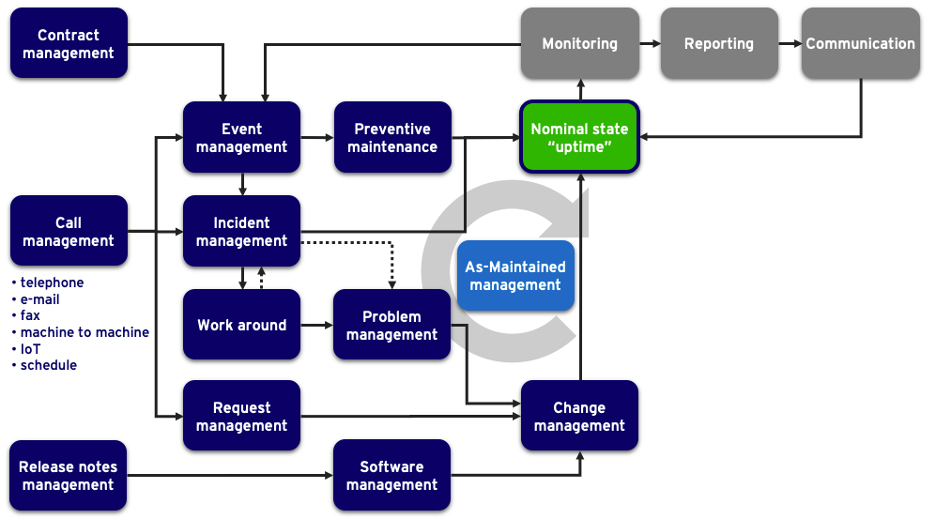
I went back to my drawing board. How shall I construct my service contracts such that I can monitor all three variables: cost, revenue and margin? In addition I implemented the basic financial concept of planned versus actual and outlook in my service execution process.

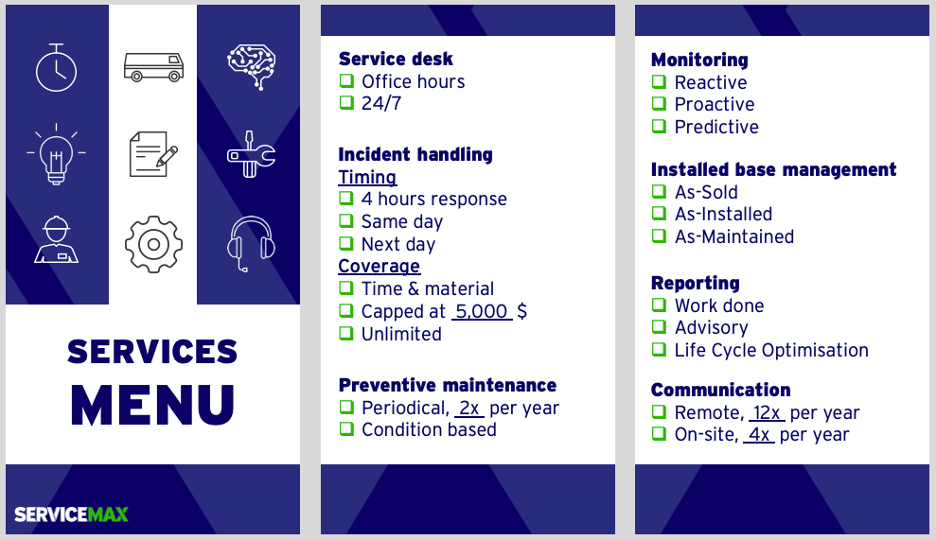
After having had my service menucard conversation with my customer, I would cost all those entitlements, resulting in the sum of planned cost. When the contract went into service-delivery mode I would keep a tally on the actual cost. If actual cost develops in a bandwidth of say 10% or planned cost, I knew I would deliver on the expected margin.

Beyond the actual cost development, modern day service execution tools also provide visibility of future service activies. Thus you can create a cost outlook as well. Now you have all the info to make the right decision in real-time, protecting your margins.

Predictive margin contribution

Why all this fuss? Apart from my personal and service domain motivation, my CFO told me loud and clear: I dislike surprises, I want predictability. If only I could cater to the CFO’s wants, maybe I could get access to budget to mature my processes.

I knew I was probably the single largest margin contributor to my companies result. Maybe more out of luck than by design. If only I could invest in tools that would give me that control and predictability.

Better and competitive pricing

Beyond the CFO persona I want to highlight role and importance of the Service-Sales persona. Setting the selling price for a service contract is a subtle process. Price pressure is prevalent in pretty much every sales cycle. The Service-Sales persona needs handles to balance revenue versus margin contribution.

Asset owners want maximum uptime at lowest operational cost.

When my cost insights were on guesstimate level, cost plus did occasionally result in non-competive price points. When my cost guesstimate was too low, my margin took a hit. When I started monitoring the actual margin, I got a good idea if I had priced my service contract ‘fairly’. Deliberately I’ve put the word fairly between quotes. High margins may be good for my bottom line, but from a customer perspective high margins may not be sustainable. Margin insights were an absolute must have for me when renewing/ renegotiating my service contracts.

This article is published on Diginomica and Field Service Digital.

Is the Service Menu Card Replacing Bronze, Silver and Gold Contracts?

During last week’s High Tech Manufacturing event in the Netherlands, we reimagined tomorrow’s service delivery in the context of vocal and demanding customers. If customers expect products to work, is it enough to mitigate downtime, or should you know why your products work and in the context of customer usage? Is your current services portfolio in line with tomorrow’s customer expectations?

Bronze, Silver & Gold Contracts

In reviewing the services portfolio I used words like bronze, silver, and gold contracts to paint a continuum of reactive to proactive and predictive contracts. In an earlier blog on Mind the Gap, I used gold to quantify your maximum services revenue.

Proverbially the gold contract is the ultimate bundle of services to guarantee the uptime of the equipment. It’s not really product-as-a-service, as the customer still needs to buy both the product and a service contract, but outcome-wise it is the next best thing.

Just like with any product or service that is sold today, B2B or B2C, the big question is: who decides what is put into the bundle? Is it a seller-push or a buyer-pull?

This is exactly the challenge the high-tech manufactures are facing today. Based on our discussions during the event, the consensus was: we need to provide more choice and autonomy to our customers. Even if the installed product is the same, the usage context is different case by case.

Product Push vs. Usage Pull

It is not uncommon that the current bronze, silver, and gold bundles are based on product characteristics. When we sell expensive and/or complex products, we tend to believe we need to offer the higher segment of bundles. But if your expensive product is used in lower utilization environments, then the cost of downtime to its owner is lower, resulting in less budget for mitigating strategies. That unit may end up with a bronze contract.

If we want to address the challenge of more vocal and demanding customers, we need to flip the bundling paradigm from product to usage characteristics. To understand those usage characteristics we need to have a mitigating strategy conversation with the owner/user of the product.

Mitigating Strategy Conversation

Dear buyer, why is my product so important to you, and what happens if my product fails? What impact does downtime have on your operations?

If your customer is buying your product, meaning there is a point of title passage, it implies that all risks associated with owning the product reside with your customer. As a product owner, your customer will define a mitigating strategy for uptime/downtime risks throughout the life cycle of the product. As OEM you can help the product owner by offering life cycle services. The owner will weigh risk versus price.

Dear buyer, do you agree with me that throughout the life cycle of the product you will need the following service activities to maintain and safeguard the uptime of the product? Which of those activities do you want to execute yourself and which ones do you want me to do?

Is the Service Menu Card is Replacing Bronze, Silver and Gold Contracts?

The above picture a derived from the ITIL v4 framework by Axelos. All boxes serve the nominal state of the product, the uptime. And uptime ensures the output and outcome of the product. If your customer agrees with this landscape of services, the conversation becomes a simple one: what level of risk does the owner/buyer want to retain, versus outsourcing that risk to a service provider in exchange for a fee.

Driving Business Results with Entitlement Process

Flipping the service bundle paradigm and handing over the choice to your customer may sound scary. Is it controllable? With modern-day field service management software the answer is yes. It’s similar to going to a restaurant. You define what is on the menu. Your customer has the choice. And any good chef knows that the personal interaction at the table when ordering is key to the choices made. The success of CSAT starts when ordering.

With modern tools, you can implement a service menu card in the service-sales process. The true value comes from pairing the menu card with an entitlement engine in your service delivery process. It’s great that you sold all those configure-to-order service contracts to meet customer requirements. The people that have to deliver the services need to be aware of what has been promised, what has been paid for, and what is billable. This is where the entitlement engine kicks in.

A sophisticated entitlement engine has visibility on the customer, the asset, the contractual obligations agreements, and on the specifics of the customer-ask as specified in the case or work order. As ‘gatekeeper’ the entitlement engine will drive:

  • Customer expectation & satisfaction
  • Leakage reduction
  • Cross & Upsell increase
Is the Service Menu Card is Replacing Bronze, Silver and Gold Contracts?

To accommodate vocal and demanding customers a service menu card is a good alternative to bronze, silver, and gold bundles. Having choice and autonomy creates engagement and builds the foundation to success and CSAT.

To stay in the restaurant analogy, the proof is in eating the pudding. Your service delivery organization needs to have insight into what has been sold/ promised and be able to act on it. Imagine the waiter bringing the food without knowing the order. No tip, invoice at risk, no return visit.

The service menu card and the entitlement engine go hand-in-hand. Say what you do then do what you say.

Learn more about service contracts & entitlements from ServiceMax here. 

This article is published in ServiceMax Field Service Digital on October 21st, 2021

Mind the Gap

At Maximize we discussed the topic of Enhancing the commercial maturity of your services business. In that conversation we spoke about ‘the Gap’. The Gap between your current service revenue and the maximum revenue you could achieve when every unit sold would have an associated ‘gold’ contract. This Gap is rather simple to calculate, and it won’t surprise me if the size of the Gap becomes a compelling reason to act.

The Gap

Why is it so important to acknowledge and quantify the Gap? If we don’t want to be like Alice in Wonderland, we need to know both our point of departure and the desired future state. 

We see more and more service executives having a revenue growth target. In the grand scheme of both service transformation and margin contribution, this makes perfect sense. As much as it makes sense, a growth ambition of eg. 20% is ‘only’ directional and not linked to a potential. To make your service revenue growth ambition actionable you need handles; metrics to monitor, levers to pull. The benefit of defining the Gap is, it is SMARTspecific, measurable, actionable, realistic and time-bound).

Let me illustrate this with the analogy of market share. Suppose you say you want to grow your market share by 20%, it makes a huge difference if your current share is 10% or 70%.

Where sales use market share, in the service domain we can use a blend of installed base visibility and attach rate. If you know where 50% of the units sold are installed, and of those units 60% have an associated service contract, you’re addressing 30% of the ‘market’. If those service contracts are a blend of warranty, bronze, silver and gold, your actual reach might be 15-20% of total addressable service market (TAM).

The above example is providing you with two things:

  • A compelling reason to act
  • Three mitigating handles

Compelling reason to Act

Let’s do some role play.

Suppose you are a service executive. You have a steady service revenue stream growing at the same rate of product sales. Your new management tasks you to grow faster than product sales, you need to grow your service revenue by 20%. What is your first response? How? Why 20%? The Gap will help you evaluate the feasibility of your new business objective. The Gap can also help you include other stakeholders in reaching your objectives. Think about sales leadership and portfolio development.

Suppose you are the sales leader. You work hard to maintain and grow market share. Growing market share by 20% is, to put it mildly, challenging. That challenge will only get bigger when your CFO changes the paradigm to margin contribution. To understand the dependency between sales and service I’ll flip to point-of-view towards the buyer of your product & services. From an asset owner’s perspective between 8-12%[1] of the life cycle cost are related to the purchase of the asset. The remainder is associated with maintenance and operational cost. This insight should trigger you and your CEO/CFO to rethink where you want to create your margin. It’s less about the one-time sale & margin of a product, and more about being able to create customer lock in throughout the life cycle of that product. Long-term contracts will deliver recurring revenue and margin contribution. The Gap is the quantification of what you are missing out on compared to a life cycle approach.

Suppose you are responsible for the product & services portfolio. Today you have a mix of warranty, bronze silver and gold. Each of those offerings has a different revenue/ margin contribution. Of course, you’d like all asset owners to buy your gold contract. The size of the Gap may be an indication to what extent your current portfolio aligns with the needs of the asset owners. Once you understand that an asset owner is more interested in using a product than owning it, your current service portfolio may need an upgrade.

Three mitigating handles

To mitigate the Gap, we’ve identified three handles:

  • Installed Base Visibility
  • Attach Rate
  • Service offering

The first one, installed base visibility, builds on a variant of Peter Drucker’s quote “if you can’t measure it, you can’t manage it”. You need to know where your assets are, and in what condition to be able to sell associated services. The bigger the Gap, the bigger your motivation should be to invest in an asset life cycle database. Documenting the As-Built, As-Sold and As-Maintained. And yes, this may be more work when your organisation sells products through an indirect sales channel. The Gap may justify the investment.

The second and third handle go hand-in-hand. Once you have visibility of the installed units, you can start targeting those with your services portfolio. Important to realise, not the product specifications and characteristics are leading in the service offering, but the use-profile of that product. For the same product, wear and tear can be completely different, based on how the product is being used. This realisation emphasises the need to collect data throughout the operational life cycle of an asset. If sales says, ‘each touch point is an opportunity’, service can extend that paradigm with ‘each data point is an opportunity’.

Is it doable?

Absolutely! A target of 20% service revenue increase may sound abstract when you get it. In this blog we tried to break that task into manageable pieces. Standard service metrics will allow you to monitor installed base and attach rates. Introducing the Gap helps you to quantify your revenue growth potential. The Gap will create both the compelling reason to act and the arguments to convince other stakeholders to jointly work on this revenue growth target.

Please share your victories with us.


[1] Source: Insight… Accenture and total cost of ownership (2012)

This article is published in ServiceMax Field Service Digital on May 11th, 2021 and Field Technologies.

Sales and Service working in Collaboration

“Which function in your organisation has the most touch points and the highest customer trust?”. Here I go again, preaching to the choir. You know where this line of thought is going. Today I want to voice a different tune. I don’t want to highlight what sets Sales and Service apart, but I want to find the common ground. Because we need each other for the sake of organisational survival and growth.

The Ugly Truth

A couple of years back I chaired the Copperberg After:Market event. In my closing remarks I provoked the audience with the word “after” in “after-sales”. Is service an afterthought? A big NO came from the delegates. Though the word “after” triggers quite some emotions and hits some nerves, let me share an ugly truth with you: after-sales does not exist without an initial sale! Service will not replace sales. Service should not compete with sales over margin contribution. Both sales and service have a role to play in customer value creation throughout the life cycle of a product. The product becomes the carrier of value creation.

Contributing Centre

So, I’m not going to ask you to raise your hands by asking if your service organisation is either a cost-centre or a profit-centre. We now agree that you are a contributing centre! Agreeing on this nomenclature is key to collaboration with sales for two reasons:

  1. In a head-to-head battle with sales, sales will claim ownership of the revenue play. You don’t want this. You want a joint role and responsibility in revenue generation and margin contribution.
  2. More conceptual, if Service were a true profit centre, Service would have had the organisational and budgetary mandate to sustain and grow service revenue. Practically all CSO’s I’ve met have a budgetary mandate up to 2,500 dollar, pound or euro. That’s not enough to drive your own margin and revenue destiny. So, maybe it is better to have Sales co-funding your new Service tools. In return you share your customer trust and high quality touch points with Sales.

Handshake

This handshake, this collaboration between Service and Sales can be explained using the technique of Causal Loop Diagrams[1](CLD).

At last year’s Maximize we did a Technician survey and asked what motivates them. In short, most technicians want to be a hero on site. With that status they create customer trust. As a result, they get high quality and contextual feedback.

What happens when technicians can’t share that information, or get a feeling that their insights are not actioned? No, this is not a rhetorical question. Ah, your organisation has an incentive scheme to encourage technicians to create leads. Does it work? Do salespeople take leads from the service domain seriously? Do service people know how to deliver leads on a silver platter?

Yes, technician insights have the potential to create more and better leads. The service domain is also a repository of information to develop new services. Services that include the voice of the customer. Services aligned with your customers use cases.

As a salesperson you would make a great impression on your customer when you display your ability to listen. That you proactively use the feedback shared with the technician. Not only will your propositions be better, also your customer will feel genuine interest and attention.

The killer feature in this Causal Loop Diagram is the reinforcement towards the technician. A reinforcement that outweighs any financial incentive scheme you can devise. Imagine how the technician feels when he/ she gets feedback that his/her discovery and insights have made a difference. A feedback coming from two directions. Firstly, the salesperson who confirms the use of the feedback. Secondly, the customer confirming that their previous conversation was actioned.

Closing the loop adds to the technician’s empowerment and his/ her increase in hero status. Guess what, next cycle this technician and salesperson will even contribute more to your bottom line.

A Groundhog Day experience

Does it really work this way? In 2016 we trialled this causal loop with more than 60 chief service officers. The results were published in Field Service News in a piece called Demand generation: A Groundhog day experience. Do share with us what your experiences are. Happy & collaborative hunting.


[1] Business Dynamics, systems thinking and modeling for a complex world, John D. Sterman, McGraw Hill 2000

This article is published in ServiceMax Field Service Digital on January 26th, 2021

Why Asset Centricity Matters

When you communicate with your garage to service your car, what is the first question they ask? Do they ask your name, or do they ask your license plate number? This is at the core of asset centricity. The asset is tracked throughout its life cycle to drive cost efficiency, revenue generation and customer satisfaction.

Know thy Installed Base

One of the first questions we ask to any organisation is what level of visibility they have on their installed base. Do you track your products/ equipment assets beyond point-of-sale?

The rationale is simple. If you want to be efficient in service delivery, you need to know where the asset are and in what state. If you want to drive revenue and satisfaction, you need to know how your customers are using the assets and why those assets are important to them in their operations.

If you don’t know your installed base, your actions will be ad hoc and be at the mercy of tribal knowledge of the people serving that customer.

Schneider Electric transformed their business model from ‘sell and forget” to “sell and service” growing their installed base visibility from 10% to 35% driving service revenue by 11% YoY.

<Insert link to Schneider customer reference>

Recognise the asset

You may know the customer, but if you don’t know the asset you may make the wrong decision. This is illustrated in the entitlement process. Entitlement is the gateway to cost control, revenue increase and customer satisfaction.

  • Leakage: provide service on an asset without warranty and/or contract
  • SLA attainment & CX: over/ underdeliver on customer expectation
  • Attach rates & revenue: miss an opportunity to cross and upsell
The role of Entitlement in Service Execution

Often, we hear organisations say that their knowledge about their assets is not yet at a level to perform a reliable entitlement process, resulting in a lot of corrective actions post work order debrief. Have a look at the Schneider electric video, collecting and validating asset data is a journey.

Tip: if by improving technician productivity the ‘saved’ time does not constitute an extra job per day, you can use the time to take inventory of the installed assets, its state and its surroundings.   

Know the asset

You might know the technical details of the assets you produce. Your maintenance manuals may prescribe what to do under nominal operating parameters. But what do you about how your customers are using the assets? Some may be ‘sweated’ and run at 99% of capacity. Others may be used occasionally only.

Having knowledge about how your assets are being used by your customers is an essential piece of information to define the right action. It will put the service request in context, help in the entitlement decision and support the triage process. It will give your customer the feeling that you’re providing contextual solutions.

Manage the asset

In the car example of the opening paragraph, the dealer focusses on the asset. The asset has a life cycle. In each phase of the life cycle different service and maintenance activities need to be executed … in combination with the usage profile of the asset.

The car may be purchased/ leased by owner A. After a number of years, the asset may transfer to owner B. If the maintenance history would be tied to the customer record, the data would be lost under ownership B. Thus, the reason why more and more organisations adopt asset centricity for life cycle continuity.

This continuity is extremely important in regulated industries. If any time in the life cycle a quality or compliance defect is detected in a series of assets, then you would like to have the opportunity to search an asset centric installed based, instead of sending messages to the owner who did the initial purchase of the asset.

Asset centricity allow you to manage your field change orders effectively. Asset centricity allows you to manage mid-life upgrades. Asset centricity is an equally powerful paradigm as customer centricity. Try to merge them into your business operations.

This article is published in ServiceMax Field Service Digital on April 14th, 2020

Equipment as a Service

Do you want to own a car, or do you want to drive it? Do you want to buy and maintain a piece of equipment, or do you want to operate it?

In our business practise we often have these conversations when reminiscing on what really matters to end-users. We tend to believe it’s about outcomes and value, call it Servitisation. Still we see a lot of conventional decision making focussed on the product and associated Capex.

Voice of the Customer

According to a research by Accenture[i] around 10% of the life cycle cost is linked to designed and acquisition. The other 90% of cost is incurred during maintain, operate and disposal. Thus, it is not surprisingly that we witness an increase in customer awareness concerning the maintain and operate phase of a product.

The maintain and operate phase is as important to the customer as it is to the supplier. Witnessing dwindling margins on the product sale, suppliers are (re)focussing on the profitable margin contribution of maintain and operate services. At the same time customers are trying to reduce their operational expenditures. Focussing on the voice of the customer is often the path to finding a long-term partnership compared to short-term commercial “victories” of either party.

We want to reduce our operational expense but realise that we need the supplier in the long run.

 Why should I own the Product

The road to servitisation often starts with a simple question: “if I only want the value/ outcome of a product, why should I bear the risks of owning it while the supplier holds all the knowledge about the product”.

  • Rolls Royce “invented” Power-by-the-hour offering because the Royal Airforce demanded a fixed cost per hour in 1962.
  • Philips created Pay-per-Lux in 2015 as a result of an academic experiment with Schiphol Airport only requesting light.
  • Bosch Siemens Hausgeräte offers refrigeration-as-a-service to housing corporations reducing total cost of ownership while at the same time minimising ecological footprint.

The common thread in the above three examples is that these manufacturers transformed their business model from one based on Capex and Title Passage to one based on Pay-per-Use and partnership.

It’s a matter of looking at a bigger picture beyond the typical functional boundaries inside any organisation:

  • Apart from the one-time-sale, what is the “win” for a manufacturer in selling a piece of equipment the customer is not able to use?
  • Apart from a short-term saving, what is the “win” of a discount for a customer when it stiffens innovation?

The transformation towards outcome-based service contracts enables both manufacturer and customer to define mutual and sustainable value.

A Product is the carrier of its Outcome

Leap of Faith

To a certain extent buying/ selling a Service rather than a Product is a leap of faith. Both manufacturer and customer are in for a paradigm shift.

  • A manufacturer will have to recalibrate from the concept of infrequent revenue recognition to sustainable margin contribution.
  • A customer will have to disconnect the outcome of a product from owning it.

Thus, we see manufacturers and customers not completely abandoning the Capex & Title Passage business model, but we see them adding a business model based on outcome-based services once their mindset embraces the bilateral value promise.

Gartner[ii] expects that by 2023, 25% of commercial or industrial OEMs will offer IoT-connected product(s) via outcome-based service contracts

Seconding the transformation towards outcome-based services is the rise[iii] of the role of the Chief Revenue Officer (CRO). With a lesser margin contribution from the product sale organisations are looking at means to tie in the margin contribution of services. With a CRO organisations are putting all their eggs in one basket regarding to drive sustainable and profitable revenue growth. Companies with a CRO are leading with outcome- and subscription-based service offerings.

Digital and Connected

In an outcome-based model the focus shifts from Owning to Using. Digital technology and connected products are the key enablers in understanding and managing product usage.

It starts with creating full visibility of how a piece of equipment performs in the business context of your customer and how costs are incurred in doing so. Next, you’ll need to have a set of levers to be able to influence the both maintenance and operate activities. Lastly, you’ll need to understand how your customer will make money by using the outcome in order define a pricing model.

In a business model based on title passage and transfer of risk to customer there is a lesser motivation for the supplier to invest in digital and connectivity. The greater the motivation is in an outcome-based model where all maintain and operate risks remain with the supplier. Technology becomes a means and necessity to mitigate those risks.

  • Digital stream lines operations
  • Connectivity creates visibility and transparency

Customers expect things to work

A second reason to invest in digital and connectivity is an increasing customer expectation that products simply must work. This implies two things:

  • Prevent a product from breaking.
  • When it does break, minimise the impact on operations.

Using technology allows us to pre-empt a failure and to minimise the impact of downtime on operations.

In an outcome-based business model both customer and supplier have an aligned interest to ensure availability of the outcome “when needed”. The last two words are essential, because no matter how much you’ll invest in preventing downtime, ultimately any product will break or need maintenance. Thus, it’s the combination of technology and understanding the outcome requirements of your customer that defines the ability to monetise outcomes.

Mutual benefit

With new outcome-based variants in the offing, we often hear the doubt: “What happens when the outcome is made available by supplier, but it’s not utilised by customer”. 

For nearly two decades we are familiar with the copying machines example where you pay per copy. Over the years copier companies have perfected their outcome-based model with their customers to mutual benefit. The mechanisms they have created:

  • Provide consultancy and software solutions to make better and more usage of the deployed copying machines.
  • If utilisation goes up, the copying machine is replaced by a larger model and the former model is deployed at customers with a smaller demand.
  • Use price breaks and contract duration to cater to customer cost predictability expectation. 

Going back to our own examples. An airline buying power-by-the-hour has a genuine interest to fly the planes. A building owner buying pay-per-lux or refrigeration can only last when having tenants. If you can find the right driver to bill your outcome, outcome-based services are the way forward. In the end we want to use products. We need medical equipment because we value life. We require construction equipment because we need buildings to live and work. We need transportation means because we want to travel. Looking forward, the Gartner prediction may be conservative.


[i] Insight into Asset Lifecyle and Total Cost of Ownership – Accenture 2012

[ii] Critical Capabilities for Field Service Management, Gartner 2019 – G00436216

[iii] Anticipating the Information Needs of the Chief Revenue Officer in 2023, Gartner 2012, G00239551, 

Mit Servicevertragspartnern ein konsistentes Kundenerlebnis sichern

Beim Aufbau und der Umgestaltung einer Serviceorganisation wird unweigerlich das Thema des Umgangs mit externen Dienstleistern und Partnern (Contractors) zur Sprache kommen. Ob es nun darum geht, zu skalieren, flexibler zu werden oder die Kosten zu senken – die meisten Diskussionen drehen sich um das „Wie“. Wie können wir eine Vielzahl potenzieller Partner verwalten und gleichzeitig die Kontrolle über Kunden und deren Erfahrungen behalten? Und was können wir tun, um die Chancen einer Zusammenarbeit zu maximieren und die Risiken zu minimieren?

Konfigurierbares Ökosystem

Um das richtige Gleichgewicht zu finden, definieren wir in der Regel zunächst Begriffe wie Outsourcing / Insourcing und (Sub-) Auftragnehmer / Partner. Je nachdem, ob Sie ein OEM (Original Equipment Manufacturer), ein Third Party Maintainer (TPM), ein Anlagenbetreiber oder ein Facility Manager (FM) sind, ergeben sich unterschiedliche Auswirkungen.

Wenn Sie also Vertragspartner zu Ihrem Ökosystem hinzufügen möchten, müssen Sie die Regeln für die Einbeziehung klar festlegen und diese mit unterstützenden Tools und Prozessen festigen. Diese Regeln können an Bedingungen geknüpft sein, die je nach Region, Produktgruppe, Art des Auftrags usw. variieren.

Partner einstufen

Ähnlich wie bei der Beziehung zu Ihren Lieferanten werden Sie wahrscheinlich ein unterschiedliches Maß an „Nähe“ zu Service-Vertragspartnern haben. Diese Beziehung ist definiert durch die Verfügbarkeit von Partnern und deren Wettbewerbsposition gegenüber Ihrem Endkunden.

Zudem bieten Servicepartner heute die Flexibilität, verschiedene Servicemodelle umzusetzen: 
Partner

  • verwenden Werkzeuge und Prozesse von einem OEM
  • bringen ihre eigenen Geräte in die Prozesse des OEM ein
  • verwenden ihre eigenen Tools und Prozesse – Arbeitsaufträge werden als Blackbox eingeplant
  • verwenden ihre eigenen Tools und Prozesse – Aufträge werden mit vollständiger Transparenz eingeplant

Diese Flexibilität erlaubt Ihnen, Ihre Partner gezielt so einzusetzen, dass Sie mehr Kunden besser bedienen können.

Kundenerlebnis messen

Sie haben nun mehr Flexibilität, Servicepartner zu nutzen, wie können Sie dennoch das Kundenerlebnis steuern? Einige unserer Kunden wünschen eine konsistente Servicebereitstellung, ohne dass der Endkunde weiß, ob der Service von ihrer Organisation oder von einem Partner erbracht wird. Andere Kunden möchten die Unterschiede zwischen den Serviceleistern hervorheben und dies als Wettbewerbsvorteil nutzen.

Um erfolgreich das Kundenerlebnis zu messen, müssen eine höhere Sichtbarkeit geschaffen, die Performance der Serviceleistungen gemessen und einheitliche KPIs für alle Serviceerbringungen definiert werden. Wenn Sie Daten gemeinsam nutzen, ohne über deren Interpretation „verhandeln“ zu müssen, können Sie Ihre Geschäftsziele an den Geschäftszielen Ihrer Servicepartner ausrichten. Infolgedessen gewinnen Sie, Ihr Contractor gewinnt und Ihr Endkunde gewinnt.

Partner messen

Abgesehen von strategischen, kaufmännischen und technischen Aspekten ist die Steuerung eines Servicepartners wie die Steuerung der Serviceerbringung. Bis zu einem gewissen Grad sollten Sie die Arbeit externer Ressourcen auf ähnliche Weise messen wie die Arbeit Ihrer internen Mitarbeiter. Ihr Endkunde soll das erhalten, worauf er Anspruch hat, gleichzeitig möchten Sie eine angemessene Marge erzielen.

Da Servicevertragspartner zu marktüblichen Konditionen arbeiten, sollten Sie sich auf die folgenden drei Messgrößen konzentrieren, da diese die Kundenerfahrung, die Serviceerbringung und die Leistung der Auftragnehmer am unmittelbarsten beeinflussen:

  • First-Time Fix: Ist die Servicequalität gut, wurde das Problem sofort behoben?
  • Mittlere Reparaturzeit: Wie lange dauert es, bis das System wieder verfügbar ist? 
  • Net Promoter Score: Ist der Endkunde mit dem Service zufrieden?

Driving Revenue Growth

Today most service executives have a revenue growth target. After having delivered cost reductions for decades, the switch to delivering revenue growth is easier said than done. Where cost control stays within the current paradigm, growing revenue requires an entrepreneurial mindset. 

When sales people need to grow revenue, their first response will be “Give me a new product, with more features at a better price point. And yes, we need a marketing budget too.” Let’s transpose this mindset to the service domain.

Give Me a New Product

Take a look at your current services portfolio. When is the last time you reviewed this portfolio? How did the services in your portfolio come to be? Was it an internal push or did you create a dialogue with your customer to develop these services?

Whether we use the word disruption or not, there are several changes to take into consideration. 

  • Customer behaviour 
  • Technology
  • Business objectives 

There are two significant trends we see at play today.

  1. From Product to Output to Outcome based services
  2. From Reactive and Preventive to Condition-based and Predictive services


Give Me More Features

At home you may have a lot of products laden with features you do not use. Those features have been added by the supplier to cater to a multitude of use-cases. You may have a comparable situation with the “features” on your services portfolio.

In growing revenue, the most important thing is to have a dialogue with your customer to change the feature push into a feature pull.

A preventive maintenance example:

You can split the preventive maintenance job into three pieces:

  1. The execution of preventive maintenance
  2. Creating a report on the findings and activities done
  3. Communicating about the job

Many customers see the execution of preventive maintenance becoming a commodity. They expect to get a report free of charge but will acknowledge its value increasing from a compliance point of view. The eye opener may be communication. When offering choices like email, telephone, video conference or communication on site, a growing group of customers will choose the latter. With equipment becoming so complex, customers want an expect to say something sensible about it. Often this visit turns out to be the largest cross and upselling opportunity.

We see two growth levers: 

  1. Suppliers adding communication “features” enter in a dialogue of value and drive new revenue streams
  2. Suppliers adding features enabled by service and digital transformation are more connected to their customers leading to more sustainable revenue

At a Better Price Point

We’ve heard various asset operators say: “Less service is more”. Meaning, the lesser a piece of equipment requires servicing, the more the operator can drive value from its use.

We also hear that OEMs providing basis break-fix and preventive maintenance services saying that these services are becoming commoditised and are under severe price pressure.

Of course, you should continue your efforts in improving your internal efficiency and curbing your cost, but the move forward is to develop services higher up in the value chain.

We see a shift:

  • From Price to Total Cost of Ownership (TCO) to Value based proposals


We Need a Marketing Budget

In Sales, growing revenue is driven by touch points, leads and conversion of those leads into a sale. In Service we have plenty of touch points and we are driven by customer satisfaction. 

  • We drive incremental sales while performing a maintenance job
  • We use customer satisfaction to the benefit of higher renewal rates attach rates post point-of-sales

Though these two actions do increase revenue, they build on existing customers in the service domain. To grow revenue further, you need to tap into a base beyond your existing service customers.

  • Sell services at time of product/ equipment sales
  • Sell services to adjacent and competitor equipment

To convince these “new” customers you need to be able to articulate how good and valuable your services are. Call it marketing.

This article is published in ServiceMax Field Service Digital on June 25th, 2018

Are Service Metrics the New Economic Barometer?

For decades the OECD[1] has been reporting a global productivity decline, while at the same time we see a rise in GDP. This triggers the question: Should the productivity metric should be augmented with more contemporary metrics in policy making and business decisions? Today we see the disruption of anything-as-a-service business models. Its success is powered by underlying service metrics.

Where productivity predominantly focusses on the efficiency of producing a product, service metrics focus on how that product is being utilised. Understanding and optimising a product’s use creates new revenue streams boosting our economy.

Responding to Volatility

Service metrics have been around for decades, only to gain more traction as other metrics fail to paint a complete picture for decision makers. Decision makers face a volatile environment with rapidly changing customer behaviour and technology. Today we must explain to customers that apart from selling an excellent product, we provide services that enable the end user to drive value from that product. Instead of the product being the goal, the product is a means to an end. More and more we’re moving towards buying the outcome of a product over owning the product.

“Velocity and scale of adoption are coming faster, making service metrics (availability, uptime, reliability) strategic to growth & success1.”

After-Sales Has Always Known

Initial product purchase relative to total product lifecycle cost

Research from Accenture[2] shows that between 8 and 12% of the life cycle cost are related to the purchase of a product. The rest of the costs are incurred during the operational phase of a product. It is typically the after-sales department that provides services during this phase. In doing so, after sales has many touch points and has a pretty good idea how the customer is using the product. In performing the services throughout the product lifecycle, after-sales generates many service metrics. The big opportunity is to use these metrics beyond the operational aspects of delivering the services.

Maturing of Service Metrics

The effectiveness of service metrics depends on the maturity of your service organisation. If you only provide break-fix and spare part services in a reactive mode, the available metrics will have a lesser potential to influence your business strategy then when selling output/ outcome-based services. For the latter, having a thorough understanding of all cost and revenue drivers is essential. The common demeanour is that service metrics drive new insights and those insights can be turned into new revenue opportunities. Zeithami[3] et al illustrate in their continuum how your services portfolio will change when maturing and shifting the focus from product to its use.

Zeithami continuum

Installed Base Penetration

Let me illustrate the maturing of a service metric and its impact on your business model. Does your organisation know where products go after they have been sold? Do you keep track of reactive and preventive maintenance activities per installed product? Do you keep track of modifications and retrofits to installed products?

When you invest in installed base understanding and connect the dots with all activities that relate to the installed product, each iteration you generate more insights to do the job better, faster and cheaper. As a result, you build trust and satisfaction with your customer. In return, the customer will tell you more about his business and how you can create more value by means of offering more and upscale services. The more you are connected to the dynamics of your customer, the more reliable your economic barometer.

From Data Consumer to Data Supplier

What you see happening in the example of installed base penetration is that after-sales is transitioning from data consumer to data provider. To deliver basic services, after-sales builds on product related info such as the as-built and warranty clauses. In delivering services, after-sales collects data on the usage of the product creating a wealth of insights from the as-maintained. The insights created from service metrics can feed both product development and market development, resulting in better products and relevant propositions driving sustainable economic growth.

Outcome Economy

On sustainable economic growth, the World Economic Forum[4] describes the outcome economy as a phase where “companies will shift from competing through selling products and services, to competing on delivering measurable results important to the customer”. This requires “a deeper understanding of customer needs and contexts in which products and services will be used”. Service metrics cater to this deeper understanding of both product and customer behaviour. It is technology, digitisation and state-of-the-art field service management tooling that drives the maturing of service metrics in both scale and real-time. Having this data at your fingertips supports situational and holistic decision making. In other words, product related services for commodity buyers and outcome-based services for value buyers.

Service Metrics as an Economic Barometer

Whether it is the maturing of the after-sales domain or the customer shift from owning a product to generating value of its use, service metrics are at the heart of both. The dotcom revolution has shown us that productivity does not have the same relevance in the automated, servitised Industrial Internet business landscape. Today, we live in a data driven economy. He/she who masters data has a competitive advantage. Service Metrics play into that game.

“It’s about unlocking data to turn valuable insights into powerful business outcomes[5].”

After-Sales Paradigm Shift

After-sales traditionally has not been a business function with a voice in strategic decision making[6] – despite contributing significantly to the margin of the organisation. With the growing value of service metrics after-sales has the potential to become a provider of valuable and strategic insights. This is a paradigm shift for the entire organisation. Productivity has its place, but pay attention to the service metrics as an economic barometer.

This article is published in ServiceMax Field Service Digital on January 8th, 2020


[1] OECD Compendium of Productivity Indicators 2017, ISBN 9789264273252

[2] Accenture 2001, Equipment Today, Service Tomorrow – the total cost of ownership vision

[3] Zeithami, Brown, Bitner and Salas 2014

[4] World Economic Forum – Industrial Internet of Things: Unleashing the Potential of Connected Products and Services 2018 – Chapter 3: Convergence on the outcome economy

[5] GE Digital strategic focus 2018, Bill Ruth

[6] VansonBourne 2016, The challenges, benefits and future opportunities of field service management

After:Market 2017 – Unleasing Service 4.0

Last week 250 service leaders attended the 11th edition of After:Market in Hamburg, Germany. For a number of years, I’ve chaired this event and presented keynotes. Over the years I’ve seen a change in dynamics both in attendants and topics covered. Not only is aftermarket reiterating its value contribution, aftermarket is also positioning itself at the core of business transformation.

To my great pleasure a growing number of attendees is having job titles like business development and sales & marketing. This year even procurement was present. The sheer observation that other functions are having an interest in service is the equivalent of “likes” on social media. The buzz is out. Service people knew that they mattered, now other functions are recognizing it.

Amongst the participants I detect a drive to unleash service on two levels:

  1. Doing things right – Daily many service people keep our assets afloat and take a pride in helping customers. To keep up with the pace of technology advancement and customer expectations, many service executives are shopping for state-of-the-art tooling.
  2. Doing the right things – Having all the data and touch points in grip, there is a realization that service is sitting on top of a gold mine to adapt/ change the business model. These service executives are shopping for how-to-get-buy-in handles. 

In my presentation “what service manager should know about sales” I mentioned a window of opportunity to initiate business transformation. If your it is the goal of your organization to grow your business rather than increasing sales, then service can lead the discussion by role playing a product-focus-scenario versus an outcome-based-scenario.

During the networking breaks and social activities, you can feel a common sense of direction. Service is working hard to get its act together on the basics. At the same time service is preparing for that opportunity to contribute to and drive the new business model.

At After:Market many speakers have shared their take on servitization, service design, product-as-a-service, digital, IoE and event procurement-psychology. Great and inspiring stuff. Especially when you tie it all together to create momentum to start your own transformation journey.

I’m looking forward to next year’s edition … and to hear from you how you have applied the insights in your organization.

This article is published in ServiceMax Field Service Digital on November 1st, 2017