Will there be an uplift in Depot Repair (vs Onsite Repairs)?

If a product requires a physical repair there are two options: a technician goes to the product or the product comes to the technician. Whatever model is used depends on many different parameters. The good news, with modern service execution tools your options grow exponentially while maintaining control.

Covid is adding an additional boost to the uplift of depot repair. If technicians are not welcome on the site of installation, then the assets, or part of it, have to come to a depot. 

A balanced choice

It would be nice if the repair model could be a choice. A choice based on situational characteristics, instead of rock solid process defaults.

Why choice? Because more vocal and demanding customers expect and request choice. Situational, because the conditions can be different each time to both requestor and provider. By giving choice you provide a level of autonomy to the recipient. Choice is double edged as well. The receiver has to process choice and thus you can get valuable information on what is important to that person. Again, what is important, changes over time and is situational.

Multiple service delivery options

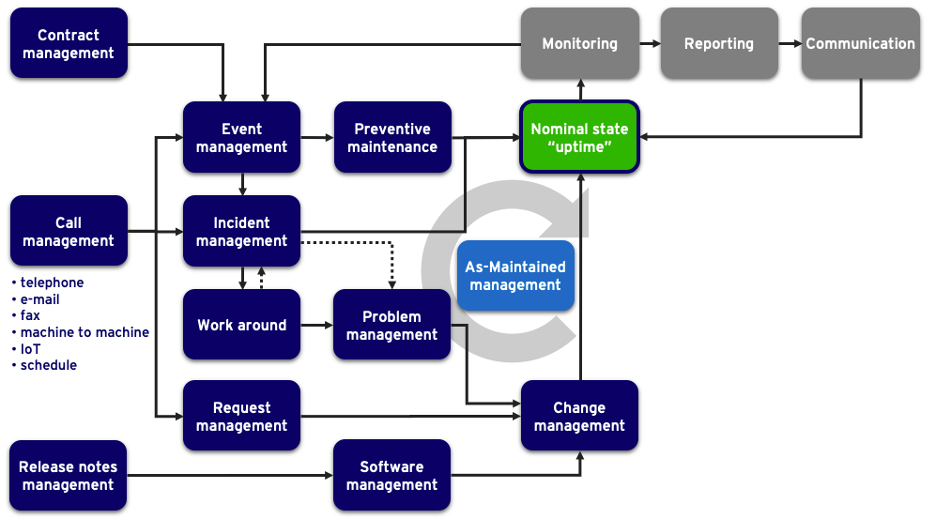
To put field service and depot service in a perspective, I want to paint the wider picture of service delivery options.

Diagram

Description automatically generated

In this picture the cheapest mode of service delivery is the self healing variant. Though cheap from a service delivery point of view, it may be expensive from a product engineering point perspective.

On the other end of the spectrum we have the dual-visit engineer on site variant. If the failure is hard to diagnose, you need a trained engineer to find the problem and define the mitigating action plan. If the spectrum of potential solutions is wide, it is likely you are not carrying all spare parts and tools resulting in a second visit for the fix.

Note: not depicted in the landscape is the NPS/ CSAT element of all these service delivery options. It is in the entitlement process that you weigh the business objectives and select the best option for that service instance.

Design for Service

The various service delivery options are very much tied to the way your products are designed. We all know the example of the owners manual of a car. The manual defines the maintenance guidelines based on a generic use profile. The setup of the service delivery in car dealerships is based on that manual. In short, the simple things are customer replaceable[1], some repairs can be done in the field, whereas others can only be done in a fully equipped depot.

A similar setup applies to the maintenance manual of capital goods. If the capital good itself is non-moveable, then it becomes even more important to design for service. It is unlikely one will deinstall an MRI to send it to a depot. It is also unlikely the technician will carry an unlimited amount of spare parts, tools and calibration equipment. Thus the manual prescribes which ‘nodes’ in the bill-of-material are fixed on-site and which ones will be swapped and sent to a depot.

The rise of depot repair

If technician capacity is scarce. If technician capacity is expensive. If customers want more uptime and faster repairs. Then it is logical that a service organisation moves from lower level component on-site repair to higher level sub-assembly swap. The effort and complexity of repairing the sub-assembly is moved from on-site to depot. As a result you can do more repairs with the same pool of technicians … and even use lesser skilled technicians.

“I used to pay 5$ for a component and 80$ for 1 hour of technician time, now I pay for a 200$ subassembly and 15 minutes of swap time”

And what is the advantage for the asset owner? It is more than only comparing the material and labour cost. You get a faster fix, alias more uptime. The new sub-assembly is fully tested and comes with warranty, alias you get better quality at lower risk. One more benefit. If the sub-assembly swap requires lesser technology skills from the technician, what if the swap could be performed by yourself? This gives you more freedom and flexibility to source those sub-assemblies.

Whether the depot model is charged as part of a full service contract or time-and-material, the value promise presents itself beyond the individual repair action. More-over, the value appraisal will be dependent on the weighing of cost & benefit factors fro both the service organisation and the asset owner.

Enabling and invoking depot repair

To facilitate a depot-model you need business process support that manages :

  • reverse logistics of the sub-assembly from customer to depot
  • facilitates the actual repair/ refurbishment of the unit in the depot
  • triggers forward logistics to get the sub-assembly back to the customer

Depending on your commercial offering, you may want to add additional features like:

  • provide a loaner while sub-assembly is in depot or
  • offer an advance exchange so only one on-site intervention is required and the refurbished unit ends up in inventory.

And maybe most important of all is getting decision-making support when to and when not to invoke of depot repair. This ties to your entitlement process and how you weigh your business objectives when your vocal customer is calling.

With modern service execution tools it’s all about connecting the dots. Using available information from Customer, Workforce and Asset to present choice to both the asset owner and the service provider.


[1] Some of you may be familiar with acronyms FRU & CRU (Field Repairable Unit and Customer Replaceble Unit). If we had to give an acronym to the depot variant, it would be called DRU.

Is the Service Menu Card Replacing Bronze, Silver and Gold Contracts?

During last week’s High Tech Manufacturing event in the Netherlands, we reimagined tomorrow’s service delivery in the context of vocal and demanding customers. If customers expect products to work, is it enough to mitigate downtime, or should you know why your products work and in the context of customer usage? Is your current services portfolio in line with tomorrow’s customer expectations?

Bronze, Silver & Gold Contracts

In reviewing the services portfolio I used words like bronze, silver, and gold contracts to paint a continuum of reactive to proactive and predictive contracts. In an earlier blog on Mind the Gap, I used gold to quantify your maximum services revenue.

Proverbially the gold contract is the ultimate bundle of services to guarantee the uptime of the equipment. It’s not really product-as-a-service, as the customer still needs to buy both the product and a service contract, but outcome-wise it is the next best thing.

Just like with any product or service that is sold today, B2B or B2C, the big question is: who decides what is put into the bundle? Is it a seller-push or a buyer-pull?

This is exactly the challenge the high-tech manufactures are facing today. Based on our discussions during the event, the consensus was: we need to provide more choice and autonomy to our customers. Even if the installed product is the same, the usage context is different case by case.

Product Push vs. Usage Pull

It is not uncommon that the current bronze, silver, and gold bundles are based on product characteristics. When we sell expensive and/or complex products, we tend to believe we need to offer the higher segment of bundles. But if your expensive product is used in lower utilization environments, then the cost of downtime to its owner is lower, resulting in less budget for mitigating strategies. That unit may end up with a bronze contract.

If we want to address the challenge of more vocal and demanding customers, we need to flip the bundling paradigm from product to usage characteristics. To understand those usage characteristics we need to have a mitigating strategy conversation with the owner/user of the product.

Mitigating Strategy Conversation

Dear buyer, why is my product so important to you, and what happens if my product fails? What impact does downtime have on your operations?

If your customer is buying your product, meaning there is a point of title passage, it implies that all risks associated with owning the product reside with your customer. As a product owner, your customer will define a mitigating strategy for uptime/downtime risks throughout the life cycle of the product. As OEM you can help the product owner by offering life cycle services. The owner will weigh risk versus price.

Dear buyer, do you agree with me that throughout the life cycle of the product you will need the following service activities to maintain and safeguard the uptime of the product? Which of those activities do you want to execute yourself and which ones do you want me to do?

Is the Service Menu Card is Replacing Bronze, Silver and Gold Contracts?

The above picture a derived from the ITIL v4 framework by Axelos. All boxes serve the nominal state of the product, the uptime. And uptime ensures the output and outcome of the product. If your customer agrees with this landscape of services, the conversation becomes a simple one: what level of risk does the owner/buyer want to retain, versus outsourcing that risk to a service provider in exchange for a fee.

Driving Business Results with Entitlement Process

Flipping the service bundle paradigm and handing over the choice to your customer may sound scary. Is it controllable? With modern-day field service management software the answer is yes. It’s similar to going to a restaurant. You define what is on the menu. Your customer has the choice. And any good chef knows that the personal interaction at the table when ordering is key to the choices made. The success of CSAT starts when ordering.

With modern tools, you can implement a service menu card in the service-sales process. The true value comes from pairing the menu card with an entitlement engine in your service delivery process. It’s great that you sold all those configure-to-order service contracts to meet customer requirements. The people that have to deliver the services need to be aware of what has been promised, what has been paid for, and what is billable. This is where the entitlement engine kicks in.

A sophisticated entitlement engine has visibility on the customer, the asset, the contractual obligations agreements, and on the specifics of the customer-ask as specified in the case or work order. As ‘gatekeeper’ the entitlement engine will drive:

  • Customer expectation & satisfaction
  • Leakage reduction
  • Cross & Upsell increase
Is the Service Menu Card is Replacing Bronze, Silver and Gold Contracts?

To accommodate vocal and demanding customers a service menu card is a good alternative to bronze, silver, and gold bundles. Having choice and autonomy creates engagement and builds the foundation to success and CSAT.

To stay in the restaurant analogy, the proof is in eating the pudding. Your service delivery organization needs to have insight into what has been sold/ promised and be able to act on it. Imagine the waiter bringing the food without knowing the order. No tip, invoice at risk, no return visit.

The service menu card and the entitlement engine go hand-in-hand. Say what you do then do what you say.

Learn more about service contracts & entitlements from ServiceMax here. 

This article is published in ServiceMax Field Service Digital on October 21st, 2021

Managing Service Profitability in the Age of Digital Transformation

Co-author: Joe Kenny

It is an age-old dilemma for Operations Managers. Your CEO wants XX% revenue growth, your CFO wants XX% cost reduction, your CRO wants better references and higher NPS scores, and you are supposed to deliver all of this with zero additional investment, because – of course – you have been doing this for years with no additional cash, so why would you need it now?

To top all of this off, you had very little idea of where you stood, operationally or financially, at any given time. And this was due to the fact that access to real-time data, a current view into work in process, and accurate financial information was all impossible to come by.

Historical Challenges for Service Operations

I often speak at conferences and participate in webinars, and I often relate this anecdote – in March I would lay out my operational plan, based on the most recent P&L statement I had received (January’s), intending to address performance weaknesses I had uncovered. My team would execute the plan and in May I would receive my March P&L to see if the response to January’s performance shortfalls were successful or not. It was madness.

Now, layer onto that, the fact that 30, 60, 90-day invoicing accruals were also Operation’s responsibility, even though we had an AP department. This process greatly impacted both revenue and cost, as the cost of service was consumed, but the associated revenue may not have arrived in 90 days.

Impact of Digital Transformation

Fast forward to today, and service operations managers have been given a lifeline—digital transformation. Digital transformation can be like a light switch, illuminating what is happening in real time, allowing service operations leaders to adapt to circumstances immediately. They can reallocate precious resources instantly, validate payment status and credit status prior to service delivery, and see and understand the impact of operational plans in real time.

Digital asset and service management platforms can provide real-time performance measurements, both foundational and top line. This includes data round first-time fix rate, mean time to repair, mean time between failures, and equipment uptime. With this data, operations managers can organize and drive for peak utilization of labor resources while ensuring that the training and quality of work are optimal. This then increases the efficiency of their organization and lowers the cost to deliver excellent service.

With today’s technology, service operations are finally on par with our commercial partners and can see and act on upsell, cross sell, renewals, and service contract extensions instantaneously. In addition, we can support sales by identifying and helping them target competitors’ equipment for targeted replacement. We are the eyes of the commercial team on the customer’s location.

Newfound Financial Control

Utilizing a digital solution allows for real-time tracking of labor, parts consumed, travel, and any other costs associated with a service call, regardless of whether it is a T&M call or in support of a warranty/service contract entitlement. This is a key advantage that enables service operations leaders to manage labor and parts expenses far more granularly. In addition, they can evaluate the revenue associated with the service provided to validate if the pricing is correct based on their revenue and margin targets.

This ability to understand the Cost to Serve on an asset or entitlement agreement in real time is a huge step forward for service operations. It gives them the data they need to truly align entitlement pricing, cost control, operational efficiency, and productivity to accurately manage and forecast their performance and address fundamental issues that are obstacles to achieving their own performance objectives.

The evolution of equipment and asset service management platforms has greatly assisted service operations professionals in attaining the insight, visibility, and control that their commercial and financial counterparts have enjoyed for decades. As asset and equipment maintenance and service becomes a larger part of most organizations’ revenue and margin contributions, it is important that they equip teams with the technology that enables them to better manage and control their operations.

This article is published in ServiceMax Field Service Digital on November 2nd, 2021 and Field Service News on October 19th, 2021.

Asset Data Remains Largely Untapped For Driving Revenue Growth

New study finds asset equipment data is key to bridging the gap between sales and service

PLEASANTON, CALIFORNIA – October 19, 2021 – Valuable data collected from servicing equipment assets remains largely untapped, unused and under monetized, offering rich potential to sales and marketing, according to new research conducted by WBRin collaboration with ServiceMax, Inc., a leader in asset-centric, Field Service Management software and Salesforce, the global leader in CRM.

The study, “Building a Bridge Between Sales and Service with Asset Data”, surveyed 100 field service leaders across the US and Canada from a variety of verticals, including manufacturing, information and communications technology, the semiconductor industry and utility sectors.

While all the organizations surveyed currently aggregate and analyze data from their field service operations, only 22 percent trust their field service data completely, indicating lack of confidence in their existing systems or procedures. And more than one-third of respondents can’t connect their field service management solution with their CRM. As a result, organizations are missing opportunities to provide better service to their clients and generate new revenue streams by monetizing data, such as personalizing marketing campaigns, driving more revenue from usage insights and analytics and demonstrating ROI in sales conversations.

While asset data remains largely under-used at present, the study also revealed that almost half of respondents (44 percent) plan to adopt or update their asset data analysis solutions in the next 12 months —including remote and virtual service support tools, asset data analysis solutions, IoT devices and sensors, and others. Likewise, at present, only 27 percent are currently utilizing their field service solutions for field service analytics, while in the next 12 months, 57 percent will deploy this capability.

“The research shows growing recognition and demand for closing the asset data gap,” said Amit Jain, Chief Product Officer for ServiceMax. “This gap exists between an organization’s current service revenue and the maximum revenue it could achieve when every unit sold could have a higher service contract attached to it. By using field data to optimize revenue and drive product innovation, product, service, sales and marketing organizations can maximize their asset performance. This critical insight is relatively new and empowers service leaders to easily shift to outcome-based business strategies that fuel growth in an age where service is now a differentiator.”

The research also found that 43 percent of organizations admit they need to improve their asset uptime and availability, lending further weight to the need for better service data and service delivery.

The full report can be downloaded here.

Salesforce and others are among the trademarks of salesforce.com, inc.

About ServiceMax

ServiceMax’s mission is to help customers keep the world running with asset-centric field service management software. As a recognized leader in this space, ServiceMax’s mobile apps and cloud-based software provide a complete view of assets to field service teams. By optimizing field service operations, customers across all industries can better manage the complexities of service, support faster growth, and run more profitable, outcome-centric businesses. www.servicemax.com

Media Contact:

Nicole Guzzo
nicole.guzzo@servicemax.com

Deploying Forms to Boost Your Business

Co-author: Allan Alexopulos

ServiceMax and Bolt Data recently had the opportunity to join ProntoForms in a session at EMPOWER‘21 to share how their capabilities enhance service solutions on the ServiceMax and Salesforce Field Service platforms. From contextual app building to bi-directional data flows, you can hear Mansell Nelson, SVP of Business Development at ProntoForms, Allan Alexopulos, Managing Director at Bolt Data, and Coen Jeukens, VP of Global Transformation at ServiceMax, cover all this and more in the session here.

xHere’s a sample of what you’ll learn about in the session:

  • Contextual app building
  • Bi-directional data flows
  • Custom contextual workflows

Recently, I had the opportunity to catch up with Allan Alexopulos about our experiences with ProntoForms in the field. We walked away with key learnings that we’d like to share with service leaders who are evaluating the business case of smart forms and checklists.

Why we use checklists

We use checklists to ensure our technicians work safely, to prove we are compliant, and to collect data. Checklists are everywhere and they are a powerful instrument. At the same time, they drive many technicians nuts. To realize true value from your checklists, it’s important to ask your technicians a simple question—how much tool-time do you have and how much time do you spend on admin?

The value of doing a ride-along

Last week I had the privilege of doing a technician ride along for a supplier of industrial gasses. A lot of those gasses are not healthy to humans, so safety is their first priority. The installations storing the gasses are configurable for each customer. So you can imagine the importance of updating the as-maintained and meter readings.

They had more than 50 forms. The longest form contained 223 questions. If you forgot to enter mandatory fields, you couldn’t save. It could get worse if the equipment was located in an ATEX zone. No electronic devices allowed. Would it surprise you that 30% of capacity was used on hands-on-tool-time and 70% on admin?

The business case here is obvious. So is the wish list of the technician. It is not rocket science—what you need is a forms tool that allows you to be smart.

Prepopulated forms

How much dual entry of data does your technician have to complete? During my ride along the technician had to repeat the entry of customer and work order data four times. It’s obvious that such data could easily be prepopulated.

In my previous role as service manager at Bosch, I learned from my technicians that a preventive maintenance job would start with pulling the previous PM report. In the old days that report would be an excel file.

  • Step 1: copy previous file
  • Step 2: rename to current job
  • Step 3: only change those fields that have changed

Compare these three steps with your current process and form design. Anything that will cause more work will reduce the adoption rate of new tools.

Contextual forms

Going back to the repository of the 50 forms. These forms were designed as generic forms, catering to all possible eventualities. I asked the technician how he knew what fields to fill and which ones to skip? His answer: tribal knowledge. And if he didn’t know, he would call a colleague.

As each gas installation was different and most customers would have their own work permit and safety guidelines, you can imagine the generic safety checklist is pretty long and error-prone.

High on the wish list is to have forms to be contextual. Maybe the most basic variant: when doing three jobs on a day for the same customer, please prompt safety questions in a smart way and not as a triple entry.

The value of an implementation partner

When talking to Allan about his recent implementation project, he shared some key learnings that allowed the team to tackle complex global compliance requirements.

The project’s goal was to streamline and standardize compliance reporting for a leading medical device manufacturer. With the combination of a deep and diverse product line, regional compliance reporting requirements, and a diverse worldwide workforce, this was the most challenging part of the global rollout of the company’s ServiceMax Field Service solution.

In addition to improving the accuracy of compliance information coming from the field, the Bolt Data and ProntoForms teams also aimed to improve the design and maintenance of the checklists used by field technicians. By working closely with ProntoForms’ R&D and services organization, Allan was able to architect the solution to create highly maintainable checklists that were then translated into multiple languages and integrated into the field technicians’ mobile devices.

As a highly knowledgeable implementation partner, Allan and the team at Bolt Data knew how to best solution to meet the organization’s needs. One of the most impactful changes was having checklists be centrally managed, which allowed for iterations to be easily rolled out as regulatory requirements change. Adding a question or changing the range of acceptable values for a question could now be easily updated and pushed to the field worldwide with a fraction of the effort and time previously required.

Reflecting on his time on the project, Allan noted, “The effort to manage compliance checklists is a fraction of what it used to be and the quality of the information coming from the field is dramatically improved, resulting in higher quality and faster compliance reporting. ProntoForms leadership and collaboration with the project team were instrumental in the success of the project.”

To learn more about deploying forms to boost your business, make sure to watch our EMPOWER’21 session on-demand here.

This article is published in ServiceMax Field Service Digital on October 5th, 2021

Keeping Your Assets in Shape

Do you have this feeling that the battery of your phone drains faster and faster? Internet forums are full of testimonials and resolutions for keeping your battery in tip-top shape. How does this apply to B2B products, equipment and assets? Can asset owners monitor the performance of the equipment, and what handles do they have to maintain output/ outcome at the nominal level promised at point of sale?

For many years I’ve captured the digital and service transformation journey in a single tagline: “from fixing what breaks to knowing what works.” The message is driven by a simple principle: customers expect things to work. Even more, they expect the outcome of the asset to be stable over the lifecycle.

Another simple truth is that everything eventually deteriorates and breaks. This prompts the following questions:

  • What is the life expectancy of the asset? 
  • What do I need to do to keep the asset in shape?
  • What can I do to extend the life cycle of the asset?

Building a Fitness Plan

Preventive maintenance might be the first thing that comes to mind as the way to keep your assets in shape. But what does preventive maintenance (PM) prevent? And how does it affect asset performance and life expectancy? This was a tough question to answer when one of my counterparts in procurement, who was looking to reduce the selling price of a service contract, asked me, “What will happen when we reduce the PM effort by lengthening the interval?” This was even more difficult to answer when it became a numbers game, and the purchaser asked me to prove the offset between PM and break-fix. 

So where do we look next? I propose condition-based maintenance.  

We know that the performance of an asset will deteriorate over time, and we know the rate of deterioration will depend on various attributes like aging and usage. Because these attributes are measurable, we can use them as levels to trigger a service intervention. 

So rather than taking a one-size-fits-all approach based on time intervals, you can create a custom fitness plan for keeping your assets in shape. One that looks at the condition of the asset in relation to its expected performance. This can look like an intervention being triggered when the output of an asset or the viscosity of a lubricant drops below a certain threshold. 

To continue with the fitness metaphor, we often don’t just want to stay in shape—we also want to increase our longevity and even get in better shape as we age. When it comes to your assets, this is where mid-life upgrades, booster-packs and engineering changes come into play. And in the same way you use predefined levers to trigger service interventions, you should use these levers to trigger updates, upgrades and lifecycle extensions.

Both of these service strategies use asset health at the core of your service delivery model, steering you away from ‘fixing what breaks’ and towards ‘knowing what works.’

A Real Life Example

Imagine you have a pump and valve combination that has a nominal capacity of 140 m3/h.

If you used a preventive maintenance model that runs every 6 months, it would not take into account the age of the pump and valve combination, nor would it account for the corrosiveness of the transported materials. 

But if you took a condition-based approach using IoT-connected sensors, you could measure attributes like vibration, temperature, and energy consumption and use them as indicators for asset performance. For example, if the capacity drops below 130 m3/h, a service intervention would be triggered. It’s like the pump saying: “I’m not feeling well, I need a medicine.” On top of this, if you detect the pump is consistently pushed beyond original specifications, you can know that it’s necessary to initiate an upgrade conversation to safeguard asset health and durability.

Asset Centricity

The common theme of these service strategies is asset centricity. It’s about putting asset health at the core of your service delivery model and continuously comparing an asset’s current output with its expected performance.

By looking at current performance, expected performance and demand, you can also advise your customers on when it’s time to downgrade or upgrade the asset. Through this asset-centric lens you can truly become a fitness coach, advising your customers on the right fitness program that will keep their assets in tip-top shape.Learn more about IoT and condition-based maintenance here.

This article is published in ServiceMax Field Service Digital on September 1st, 2021 and Field Service News on August 25th, 2021.

How to Use Service Marketing to Grow Service Revenue

Over the last five to ten years, a growing number of Chief Service Officers (CSOs) have been assigned a service revenue growth target—a trend recently confirmed through research by Noventum, which found that more than 85% of product manufacturers have set a growth target for their service function. As this trend gains steam, we think it’s worth examining how CSOs can achieve service revenue growth and what they can learn from the sales side.

If you ask a salesperson to grow revenue, they will ask for two prerequisites:

  • More and newer products with more features at a better price point
  • A marketing budget to target the addressable market

What does a CSO ask for when receiving and accepting a service revenue growth target? For many CSO’s, growing service revenue and using service marketing is unchartered territory.

What’s your marketing budget?

Up to 2012, I managed my service operations at Bosch as a cost center. At that time service was the single largest margin contributor to the company. In 2012, I received service revenue growth objectives. Simultaneously my role transitioned from the service domain to the sales domain. In my first conversation with the chief revenue officer, I was asked: “What marketing budget do you need?”

Having run service operations for 25 years, my automatic response was to first focus on achieving excellence for the existing service delivery capabilities. After a crash course in sales and marketing, I revised my strategy. Sell first. Secure the revenue. Use the revenue to finance the maturing of your delivery capabilities.

The result: a quadrupling of service revenue in five years. How? By focusing on two items:

  1. Using the voice of the customer to develop a services portfolio
  2. Setting up service marketing for the installed base

Developing a services portfolio

Back in 2012, I was so focused on service delivery, it never crossed my mind to challenge my services portfolio. My sales colleagues explained to me that a portfolio with sufficient choice is the basis for revenue generation. We then set on a course to create a services portfolio with selectable features and differing price points. Our goal was to create an “a la carte” menu card.

The true test was to come. Would our customers buy the items from our menu card? This is where we realized our need for a true marketing function. A function to help us frame the value messaging and to reach out to the target audience.

Setting up service marketing

First, we looked at the value promise our company made to its customers. Is that value promise pertaining to owning the product and/or is it about using the product throughout its lifecycle? How does our menu card of lifecycle services fit in? And how do we facilitate product owners in making the right service lifecycle choices?

In setting up a marketing function for service, we used our sales colleagues as reference. In the world of sales, key metrics are Total Addressable Market (TAM) and Market Share. Marketing uses these two parameters to spearhead campaigns. In the world of service, these two metrics can be substituted by Installed Base penetration and Attach Rates.

Total addressable market

Suppose you have installed base visibility of 100% and all those units have an attached service contract. Suppose all those contracts are of the type gold-service. The sum of that equation is your maximum achievable service revenue. You could label this as your service-TAM. If your organization also services units of competing brands, the service-TAM will be bigger.

Market share

Your current actual service revenue is the compound result of two factors – your ability to drive installed base visibility and attach rates, in combination with the attractiveness of your services portfolio.

The gap

As mentioned in an earlier blog Mind the Gap, the delta between your service-TAM and your actual market share is your revenue gap. This gap encompasses your target audience for service marketing. The larger the gap, the bigger your compelling reason to review your services portfolio and to establish a service marketing function.

Targeting your audience

Service marketing has one big advantage over sales marketing: with a field service management system focused on asset-centric business models, marketing will have the perfect data set to drive targeted campaigns:

  • Knowing where your installed base is
  • Knowing the state of the asset and how the asset is being used
  • Having a record of the maintenance history
  • Knowing what engineering change orders and modernizations have been implemented
  • Visibility to the current service contract and entitlements

As one of our customers told us:

“We operated a model of sell and forget. Now we sell and service. We have invested in installed base visibility, attach rates, our services portfolio and service marketing. We are now on a deliberate and conscious path of service revenue growth.”

Setting a budget

Knowing what I know now, I would respond differently to my former chief revenue officer. I would request a service marketing budget to revisit my services portfolio and to initiate targeted marketing on my revenue gap.

I would not hesitate to commit to service revenue growth targets, knowing the service delivery organization had an asset-centric field service management system.

This article is published in ServiceMax Field Service Digital on August 25th, 2021

Using trigger points to manage your service business

Sometimes it feels like being a jack of all trades when managing a service business. On the one hand you act like a firefighter, on the other hand you know service is strategic to your business’s future earnings. That said, how do you elevate your job from the reactive to the proactive? Establishing trigger points may be the key ingredient to manage your business on an 80/20 basis. Thus, giving you the focus on interventions that matter.

Define success

When do you know you are doing a great job? In speaking to many service executives, it is not always clear what the norm is. “We want to increase service revenue by 20%”. Why 20%? Why not more? Why not less? In my blog Mind the Gap I tried to establish a norm for a maximum service revenue. In a blog by Shawn LaRocco he defined a norm for Cost to Serve. Both blogs have in common that success is put in a perspective of a norm.

Triggering the outliers

A facilities management customer of ours is processing 15,000 – 20,000 workorders per month. In the past they had a team of 30+ people in the back office validating and correcting all debriefed work orders. Based on gut feeling and experience there was a belief that 80% of the work orders did close within a bandwidth of ±5% of expectation. By formalising that bandwidth through trigger points, they now have a tool to filter the volume and start managing by exception.

Timely intervention

Apart from managing your workload on a 80/20 basis, trigger points serve as an early-warning system allowing for timely intervention. You don’t want to pay penalty cost for a missed SLA. Instead, you want a service job to be flagged if its progress jeopardises SLA attainment. E.g., a break-fix job needs to be completed within 4 hours. After 3 hours you could ping the technician to ask if completion is still on track. If not, you could provide the technician with support and/or contact the customer with a heads up.

A trigger point is thus a floor or ceiling boundary on a metric triggering an event. Using workflow, you can route the event to the mitigating personas in your organisation.

Value = Result minus Expectation

Many years ago, the value of trigger points was eloquently explained to me by university professor Meindert Flikkema. He stated that every event has both an expectation and a result. If somebody gets more than expected, then that person is happy … and vice versa.

In the context of running my own service organisation at Bosch I tweaked Meindert’s equation and added the concept of a bandwidth around expectation. Similar to the above example of ±5%, I strived to manage my operations inside the bandwidth. Inside the bandwidth I let the business run on automations. If I managed well, that would account for 80% of my workload. The outliers I routed to my attention queue. Over time trigger points would help me focus on what really matters for both my customers and my CFO. I’ll use the business driver contract profitability to illustrate the value equation and its impact.

Contract profitability in action

Suppose a customer wants to buy a full-service contract with a scope-of-work containing preventive maintenance, capped break-fix events, calibrations, software maintenance and an included set of spare parts and consumables. Using a CPQ-like tool the scope-of-work totals to a calculated cost of $75,000, a calculated revenue of $100,000 and an expected margin of 25%.

Throughout the lifecycle of the contract executed service activities will impact the cost you accrue. If those cost exceed the $75,000 you have either over-delivered or over-run on your calculated cost. Your CFO will see a less-than-expected margin contribution. If your margin is significantly more than the expected 25%, then either you are over-charging or under-delivering. Your customer may get a feeling he/she is not getting value for money. 

Tipping the trigger level should make you curious. Challenge both expectation and result. Do you have a clear understanding of cost-to-serve? Are you taking the life cycle of the product into account? Did the product owner accept your mid-life-upgrade proposal?

Pro-active

As service leader you don’t want to be told about under or over-situations by your CFO when it is too late for corrective intervention. Similarly, you don’t want you customers to churn. Trigger levels act as an early-warning system before you accrue irreversible cost or impact customer expectation negatively.

  • It’s November. Show me all contracts at 80% of calculated cost. Let’s see what service activities we can push out to ‘save’ this years’ margin contribution.
  • It’s July. We anticipated six break-fix events for a full year. We’ve already had four. We want to flag future break-fix service requests to inform the customer service agent and technician to be stricter.
  • It’s September. The year-to-date contract margin spikes at 35%. Upon investigation you find that a contracted and scheduled calibration activity has been cancelled by the customer. Instead of treating this as easy money, you engage with your customer to pre-empt contract renewal conversations.

Managing intelligent

As long as we have unplanned downtime, firefighting will remain an element of a service leaders’ job. Service execution tools are a great help to facilitate the transaction and collect service data. The true value manifests itself when you use transactional data in combination with trigger levels. Trigger levels give you that early-warning to become pro-active instead of reactive. Trigger levels add direction to your decision making. And better decision making makes you more intelligent and more strategic. Not only inside the service domain, but across your organisation.

This article is published in ServiceMax Field Service Digital on July 27th, 2021

Why Are Sales Leaders Taking Over Service?

For a couple of years now, I’ve been writing about the convergence of Sales and Service. Service, with all its touchpoints during the operational life cycle of a product, has a tremendous capacity for value creation. To reap that value, Service needs a little more Sales DNA. Likewise, Sales needs a little more heart for Service. With a shift from revenue contribution to margin contribution, we see Sales ‘taking over’ the Service Revenue agenda.

You Now Report into Sales

A true story. I’ve had extensive experience running service departments. In all those years my main objectives were focused on service delivery and operational excellence. Over time, I saw an increased interest in service margin and service revenue. When my former organization updated my business objectives with a service revenue target, that goal came as part of a package deal: “you now report into Sales.”

Initially, I did not understand how reporting into Service or Sales when having a service revenue target would make a difference. At that time, the prevailing current was that revenue generation was the prerogative of Sales. Service was seen as a delivery engine focussed on operational gain.

Over the years, I’ve witnessed a dynamic between Sales and Service when it comes to the ‘claiming’ of business case benefits. Lately, a CEO put the reasoning into works while we presented the business benefits of a digital and service transformation project to his executive team. The CEO attributed productivity and cost savings to operations and service. He associated revenue targets with sales. When our business case showed significant revenue benefits through improving installed base visibility and attach rates, sales were the first to claim credits and ownership. For sales, these two improvements translate into touchpoints and conversion. This duo is the bread-and-butter of the sales process.

Bridging Sales and Service

Though sales leaders may be taking over the revenue growth agenda, we all know there is a huge difference between selling products and selling services. The engagement model is different. The buyer role is different. The appraisal of Capex versus Opex has a different impact on decision-making, etc. Most of all, it’s a simple numbers game. Sales revenue is big numbers, service revenue is smaller numbers: Guess who will be seen as the hero?

Any CFO can tell you that services, despite carrying a lower revenue amount, often have a significantly higher margin contribution. What if we were to start incentivizing salespeople with a margin contribution target rather than a revenue target? Great idea? Too radical? Maybe such a move could swing the pendulum in the opposite direction. If all your salespeople were selling services, you would forget you need an initial product sale to make the model work.

So we are back to an earlier blog post I wrote about the importance of Sales and Service Working in Collaboration. The initial product sale is like an ‘entry ticket’ to selling adjacent services. Using the analogy of a theme park, say Universal Studios or Legoland, once you are inside and start spending money, that’s where the EBIT is made. It is the achievement of ticket sales to get you inside. It is the effort of the entertainers to keep you inside as long as possible…and spend money. Are both roles different? Yes. Is one role more important than the other? No.

Building a Portfolio of Lifecycle Revenue Generators

We can transpose the analogy of a theme park to the world products and services by illustrating two common situations:

  • Product sales over-promises: Making it hard(er) for service to sell attached services. In effect, you’re trading high-margin contribution activities for a lower margin contribution.
  • Services portfolio not appealing enough: Making it hard(er) to generate service revenue and providing customers with reasons to churn.

Both examples should compel any product/services company to rethink their revenue generation and margin contribution ‘building blocks.

More and more sales leaders are understanding that revenue generation spans the entire lifecycle of the sold product. The realization that the post-sales value proposition has a symbiotic relationship with the pre-sales value proposition, triggers sales leaders to claim control of the services portfolio and the lifecycle go-to-market strategy.

Now you are thinking: is this the job description of a Chief Revenue Officer (CRO)? Yes, you are close. When a buyer applies a concept like total cost of ownership (TCO) in weighing a purchase, then the response on the sales side converges in the responsibilities of a CRO.

Is it bad for Service when Sales leaders are taking over? I believe not. I think Sales and Service have different but complementary skills to drive the revenue growth agenda. Sales DNA finds Service Heart!

This article is published in Diginomica on June 9th, 2021 and ServiceMax Field Service Digital on June 17th, 2021

Mind the Gap

At Maximize we discussed the topic of Enhancing the commercial maturity of your services business. In that conversation we spoke about ‘the Gap’. The Gap between your current service revenue and the maximum revenue you could achieve when every unit sold would have an associated ‘gold’ contract. This Gap is rather simple to calculate, and it won’t surprise me if the size of the Gap becomes a compelling reason to act.

The Gap

Why is it so important to acknowledge and quantify the Gap? If we don’t want to be like Alice in Wonderland, we need to know both our point of departure and the desired future state. 

We see more and more service executives having a revenue growth target. In the grand scheme of both service transformation and margin contribution, this makes perfect sense. As much as it makes sense, a growth ambition of eg. 20% is ‘only’ directional and not linked to a potential. To make your service revenue growth ambition actionable you need handles; metrics to monitor, levers to pull. The benefit of defining the Gap is, it is SMARTspecific, measurable, actionable, realistic and time-bound).

Let me illustrate this with the analogy of market share. Suppose you say you want to grow your market share by 20%, it makes a huge difference if your current share is 10% or 70%.

Where sales use market share, in the service domain we can use a blend of installed base visibility and attach rate. If you know where 50% of the units sold are installed, and of those units 60% have an associated service contract, you’re addressing 30% of the ‘market’. If those service contracts are a blend of warranty, bronze, silver and gold, your actual reach might be 15-20% of total addressable service market (TAM).

The above example is providing you with two things:

  • A compelling reason to act
  • Three mitigating handles

Compelling reason to Act

Let’s do some role play.

Suppose you are a service executive. You have a steady service revenue stream growing at the same rate of product sales. Your new management tasks you to grow faster than product sales, you need to grow your service revenue by 20%. What is your first response? How? Why 20%? The Gap will help you evaluate the feasibility of your new business objective. The Gap can also help you include other stakeholders in reaching your objectives. Think about sales leadership and portfolio development.

Suppose you are the sales leader. You work hard to maintain and grow market share. Growing market share by 20% is, to put it mildly, challenging. That challenge will only get bigger when your CFO changes the paradigm to margin contribution. To understand the dependency between sales and service I’ll flip to point-of-view towards the buyer of your product & services. From an asset owner’s perspective between 8-12%[1] of the life cycle cost are related to the purchase of the asset. The remainder is associated with maintenance and operational cost. This insight should trigger you and your CEO/CFO to rethink where you want to create your margin. It’s less about the one-time sale & margin of a product, and more about being able to create customer lock in throughout the life cycle of that product. Long-term contracts will deliver recurring revenue and margin contribution. The Gap is the quantification of what you are missing out on compared to a life cycle approach.

Suppose you are responsible for the product & services portfolio. Today you have a mix of warranty, bronze silver and gold. Each of those offerings has a different revenue/ margin contribution. Of course, you’d like all asset owners to buy your gold contract. The size of the Gap may be an indication to what extent your current portfolio aligns with the needs of the asset owners. Once you understand that an asset owner is more interested in using a product than owning it, your current service portfolio may need an upgrade.

Three mitigating handles

To mitigate the Gap, we’ve identified three handles:

  • Installed Base Visibility
  • Attach Rate
  • Service offering

The first one, installed base visibility, builds on a variant of Peter Drucker’s quote “if you can’t measure it, you can’t manage it”. You need to know where your assets are, and in what condition to be able to sell associated services. The bigger the Gap, the bigger your motivation should be to invest in an asset life cycle database. Documenting the As-Built, As-Sold and As-Maintained. And yes, this may be more work when your organisation sells products through an indirect sales channel. The Gap may justify the investment.

The second and third handle go hand-in-hand. Once you have visibility of the installed units, you can start targeting those with your services portfolio. Important to realise, not the product specifications and characteristics are leading in the service offering, but the use-profile of that product. For the same product, wear and tear can be completely different, based on how the product is being used. This realisation emphasises the need to collect data throughout the operational life cycle of an asset. If sales says, ‘each touch point is an opportunity’, service can extend that paradigm with ‘each data point is an opportunity’.

Is it doable?

Absolutely! A target of 20% service revenue increase may sound abstract when you get it. In this blog we tried to break that task into manageable pieces. Standard service metrics will allow you to monitor installed base and attach rates. Introducing the Gap helps you to quantify your revenue growth potential. The Gap will create both the compelling reason to act and the arguments to convince other stakeholders to jointly work on this revenue growth target.

Please share your victories with us.


[1] Source: Insight… Accenture and total cost of ownership (2012)

This article is published in ServiceMax Field Service Digital on May 11th, 2021 and Field Technologies.