Developing Engineering Change Strategies for CX and Customer Engagement

Each time when you launch an engineering change (EC) campaign you’ll have to balance brand image, quality and cost. In my previous blog 3 Steps to Make Engineering Change Management Easier (FSD, March 2nd, 2021), I added two additional business drivers: customer engagement and upsell revenue. I promised to elaborate on EC strategies, on how to use the EC touch points to further your business objectives.

But first I want to say thanks to a reader who helped me frame the two different emotions associated with an engineering change: the ‘positive’ and the ‘negative’ engineering change.

  • Negative: the EC is triggered by a quality issue or a complaint.
  • Positive: the EC improves the specifications/ capabilities of the original product.

Does the emotion matter? Yes, it does and maybe it shouldn’t matter that much. Let me explain.

When the negative emotion is associated with cost and a perceived reduction of CX & brand value, its mitigation is deemed operational. Getting your act together. When using the EC as an instrument to exceed expectations, the positive emotion will trigger growth driven stakeholders to jump on the bandwagon. With a comprehensive EC strategy, you can nudge the negative to the positive side too.

“There’s no such thing as bad publicity” – P.T. Barnum (1810 – 1891) 

Creating a plan

Creating an engineering change strategy is a subset of product life cycle management. During the operational life cycle of a product many things can happen. Some of these occurrences are pre-conceived and/or planned. Some will happen ‘as you go’. Simply because it is nearly impossible to predict how a product will behave in each and individual use context.

Creating a plan is like preparing for the unknown. The good news is that the unknown can be moulded into a limited number of buckets:

  • The product does not deliver on its as-sold and nominal attributes
  • The product is used in a context beyond its nominal attributes
  • New product capabilities enhance the nominal specifications

For each of the three buckets you can create a communication channel with your installed base and define a follow-up workflow. As a potential response to each of the three buckets:

  • Document and investigate the gap, provide a product fix … or change the expectation.
  • Investigate the use context of the product and re-evaluate the product specifications. Advise on product replacement or product upgrade possibilities.
  • Filter the installed base on those customers that will perceive the enhanced specifications as a value add.

Each of these workflows impacts cost, revenue and CSAT. Most of all, you build a communication relationship with your installed base, managing customer experience over the life cycle … and beyond. Just imagine your EC strategy becoming the proactive/ predictive instrument to avoid unplanned downtime.

What does your customer buy and expect?

Words like strategy and lifecycle imply a longer timeframe. This requires us to revisit the original value promise made at point of sale. Is that promise a one-off or a longer-term commitment? The answer will impact your EC strategy.

If the sales value promise is a one-off, the customer buys the product as-is with an optional limited warranty. Because warranty is an integral part of the product sale, we need to define both coverage and period. Also, we must be mindful of expectations and regulations.

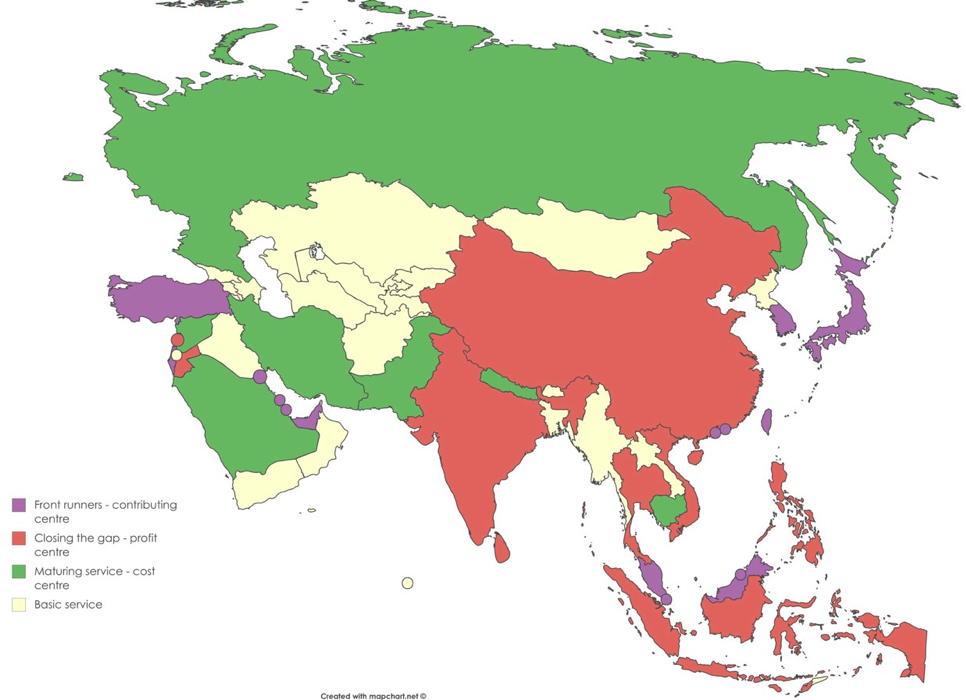
  • In Japan the phrase “Quality is included” drives EC and lifecycle services to high expectations with ample opportunities to monetise them.
  • In Germany the warranty construct is decomposed in two definitions “Gewährleistung” and “Garantie”. The former relates to a defect and/or violation of regulations, the latter is a voluntary value promise.
  • When you buy a product from a AAA-brand you’ll likely have a different lifecycle support expectation over a B-brand.

With the above components it becomes clear that you’ll need a product lifecycle vision with an EC strategy spinoff.

A steady flow of engineering changes waiting for a framework

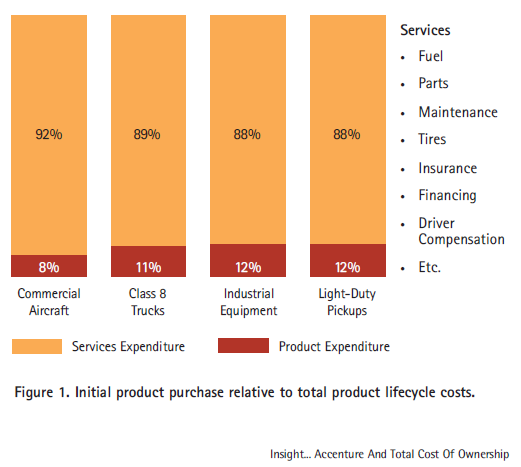
Now, let’s expand the horizon beyond the warranty period. Your customer may have bought a product. What your customer needs is the output and outcome of that product, preferably over a longer period of time. Over that time entropy and technology advancement are the biggest drivers for engineering changes. 

Knowing you’ll have a steady flow of ECs you’ll need a framework to manage them. Even more so when we’ve learnt in the previous blog that ECs often occur in an environment of constraints. You’ll need to make choices of who gets scarcity first, knowing this will impact cost, revenue and CSAT. 

Scarcity is a multi-facetted ‘beast’. It can work both for and against you. Thus, one more reason to put a lot of thought into defining an EC strategy.

“There is only one thing in the world worse than being talked about, and that is not being talked about.” – Oscar Wilde

Every touch point is an opportunity

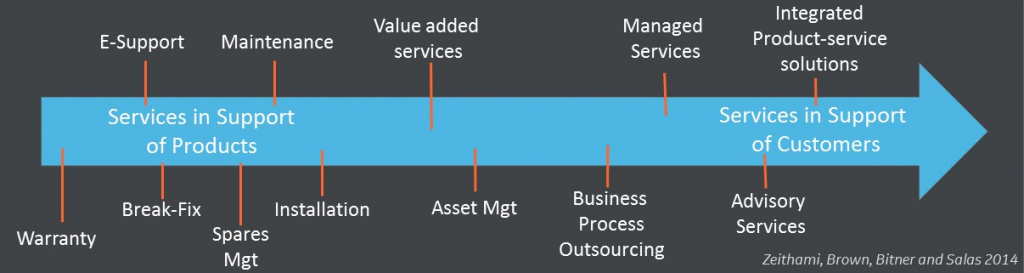
In the world of sales and engagement the mantra is: every touch point is an opportunity. Throughout the operational life cycle of a product there are many touch points. When you can explain entropy and technology advancement in its use context, when you have a compelling engineering change strategy and when you can embed that EC strategy in your service portfolio, then you’ll get the level of engagement and life cycle partnership you seek. Driving cost, revenue and CSAT to both party’s satisfaction.

This article is published in ServiceMax Field Service Digital on May 4th, 2021

Finding Revenue Leakage in your Service Business – part 2

Do you know what your maximum service revenue potential could be based on the product units your organisation sells? Is your current service revenue less than this maximum? And, do you have a process to upsell service contracts into your existing installed base? One or more puzzled looks, chances are big you are suffering from Upsell-leakage. 

In the previous episode we have defined two types of leakage; Contract and Non-Contract leakage. In this episode we’ll define Upsell-leakage. Most likely upsell leakage will be twice as big as the other two combined.

Upsell leakage

As service organisation you’d like all your customers to buy your premium service. Some customers will buy ‘gold’ service level for their installed base, others will be happy with ‘basic’ service. It all depends on the use case of your customer and their propensity to value the services you offer. As use cases tend to change over time, you may want to consider setting up an upselling program using the touch points from your service delivery. 

If you don’t ask, you don’t give them the opportunity to say yes

Not having such a programme deprives you of revenue potential; being the delta between your current service revenue and ’gold’ service level.

Defining the upsell service revenue potential

To quantify upsell leakage we can use a mechanism known to Sales as TAM (Total Addressable Market). Suppose you sold 1,000 units at $10,000 each. Suppose a ‘gold’ service contract has an annual selling price of 12% of the unit selling price. This would put your service-TAM at $1,200,000 per annum.

Imagine your service department has 600 of those 1,000 units on their radar screen. The rest is sold via an indirect sales channel and/ or lost-out-of-sight. This gives an installed base visibility of 60%. Let’s assume those 600 units generate a service revenue of $400,000, split across:

  • 10% of units are in (OEM) warranty and don’t generate revenue (yet)
  • 50% of units have a bronze, silver or gold contract generating $240,000
  • 40% of units don’t have a contract and generate $160,000 in Time & Material (T&M)

With the above figures you currently reap 33% of your service-TAM and you have an upsell potential of $800,000. Monitoring this upsell leakage metric should give you the incentive to put a revenue generation program in place.

Metrics driving upsell leakage

In the numeric example we’ve touched on three metrics that impact and drive upsell leakage.

  • Installed base visibility: it all begins with installed base visibility. Units not on your radar screen will not contribute to your service revenue! This is easier to manage for units sold via your organisation’s direct sales channel, though it does require an effort to manage the life cycle from as-sold to as-maintained. For units sold via the indirect sales channel you’ll have to exert extra effort to get access point-of-sale data, maybe even ‘buying’ the data.
  • Attach rates: both warranty and contracts are attached to the unit, thus driving attach rates. Attach rates are ‘boolean’, they say something about having an attached contract, not about the amount of revenue you get through that contract. Attach rates start at the installation/ commissioning date of a unit. Either Sales makes the attached-sale at point-of-sale of the unit or the Service department drives the attaching post-point-of-sale. Driving metric for Service is to maintain a continuum of attachment throughout the life cycle of the unit. 
  • Service revenue contribution: Within the subset of attached contracts you’d like to have as much revenue contribution as possible, ‘gold’ service being the holy grail. Per service contract you could have any of the following revenue contributions:
    • OEM Warranty: 0% of Service-TAM
    • Enhanced Warranty: 33% of Service-TAM (only the on-top-of OEM warranty piece)
    • Extended Warranty or Basic service: 67% of Service-TAM
    • Gold: 100% of Service-TAM

In terms of merchandise, you can’t force anyone to buy something

Remedying upsell leakage

The overarching paradigm to growing service revenue is twofold: increasing your installed base visibility and making sure you have attached offerings to those units. 

Getting visibility on units sold via the indirect channel is slightly more complicated, but once you quantify the associated service-TAM with those units, you may have the ‘funding’ to ‘buy’ the data. This may even lead to revenue sharing models with your channel partners.

The last piece of the puzzle is using the visibility of the upsell leakage gap whenever you have a touch point with your customer. Note that the original (service) contract has been drafted many months ago by people whom are further away from the business, who could not 100% envision the service reality of today. You thus may end up in an entitlement conversation where the customer has an urgent requirement whereas the contract ‘only’ covers for the ‘basics’. The delta is an upsell opportunity. Either resulting in an upgrade of the service contract or maybe only upgrading an incidental work order. In case the latter happens more often, you have the data points to convince the customer for the former.

Now, understanding that upsell leakage is potentially twice as big as contract and non-contract leakage together, you may have found your compelling reason to start another revenue growth project.

This article is published in ServiceMax Field Service Digital on November 19th, 2020 and Field Service News on Jun1 1st, 2021

Finding Revenue Leakage in your Service Business – part 1

Have you ever had to Credit or Discount an invoice? If the answer is ‘yes’ then you have leakage, if the answer is ‘no’ then you definitely have leakage.

How do you respond to the Aberdeen finding that best-in-class companies have a whopping 14% warranty & contract leakage? Denial, absurd, overstated, or … wait-a-minute, maybe I’m not looking at the right KPIs to detect leakage. Once you acknowledge leakage exists in your organisation, wouldn’t you go all the way to manage leakage out of your business, knowing it has a direct impact on your bottom line?

Defining leakage

What is service leakage? In the simplest terminology: you are losing money. And the bad news is that it often happens without you knowing or realising it.

We can distinguish two types of service leakage:

  1. Non-Contract leakage : the periods in the operational life cycle of an asset not covered by warranty and/or a service contract (sometimes this is also called T&M-leakage because service outside a contract classifies as T&M).
  2. Contract leakage: an asset is covered by warranty and/ or a service contract but in your service delivery you provide more and/or a higher level of service than the customer is entitled to. 

Contract leakage typically occurs when service organisations do not know and/or manage expiration dates of warranty and contracts. Non-contract leakage typically occurs when the entitlement process is fragmented and/ or when the information is not accessible to all involved service actors.

Let’s mention a couple of common scenarios:

  • A customer claims a defect within the warranty period. You correctly entitle the job as ‘warranty’. On site the technician detects ‘customer induced damage’. The technician performs the repair anyhow and there is no charge to the customer.
  • A customer is entitled to next day service but presses you to fix the machine today without paying an additional fee. Because your technicians are not busy today, you give in to the request.
  • A customer makes a service request assuming the current contract is still active. Upon entitlement check you detect it has expired three months ago. The customer agrees to renew the contract per current date. You incur 3 months loss in contract revenue.
  • A customer has multiple machines of the same model. Only one of them is covered by a contract. The single contract line is used to entitle work on all of them because the customer always uses the same serial number.

Service Leaks are not the problem; they are the symptom. They reveal a disconnect between process design and actual behaviour. Denial of leakage increases the disconnect.

Impact of leakage

One of the unfortunate things in business is that the cost always hits you – now, if you are so good at capturing cost why do you allow revenue to slip through your fingers? How do you think your shareholders would enjoy hearing that you worked on a customer’s asset and neglected to bill them? 

Another way to look at the impact of leakage is to establish how much extra revenue would need to found above and beyond what you are already billing for. Let me paint a picture for you, as we have established you capture all of your costs so any leakage (missed revenue) that you capture will have a 100% positive impact to your bottom line – every dollar billed will be a full dollar of equivalent gross margin. So, let’s say you were running at 20% margin as a service organisation and you allowed $100,000 to leak through your service organisation, now a service org would need to go and find $500,000 of brand spanking new business to offset this $100,000 leakage just to break even. How hard is it for a business to find $500,000 of extra revenue with the same resources? 

Actually, quite easy – set your system up to minimise the risk of leakage….

On top of the cost, revenue and margin contribution impacts, customer expectation is a big one. Leakage has a very large behavioural component. If a customer is used to getting service for free, it becomes very difficult to start charging for it. If a customer ‘discovers’ you can’t manage your entitlements correctly, this may lead to ‘unwanted’ service calls.

A similar behavioural impact can be expected on the technician’s end. A technician chose his job because he/she wants to fix things and be a hero on site. A technician did not select the job to do admin and become a contract-referee. Thus, if you do not empower your technicians with the right tools and information, do not expect any cost/revenue sensitivity, they will go for CSAT and please the customer.

Finding leakage

Do you find leakage or is it a matter of ‘capturing’ it? You are delivering all of the services that create the opportunity for leakage, so you already know where it is, you just need the correct tools to capture it, Oh and by the way,  they are never humans and excel… You need a robust process and a software solution to support that process and remove ‘chance’ from the equation. 

Detecting, quantifying and finding the origin of leakage in your organisation is a process like remedying a leaky roof. You’ll need adjacent ‘instruments’ to find the source.

Remedying leakage

The first step towards remedying leakage is accepting its existence. Once you have made leakage visible, you can start actioning it. And in general those actions fall into three categories:

  1. Stop delivering free service; this has a direct cost reduction benefit.
  2. Continue delivering ‘free’ service and start charging for it; this will increase both your revenue and your margin; the additional margin is 100% as we have shown you have already incurred the cost.
  3. Continue delivering ‘free’ service and use it as collateral for something else of value; this benefit is harder to manage, but we can argue it is good for CSAT and can be used during contract renewal to counter cost & rate reduction arguments from your customer.

This article is published in ServiceMax Field Service Digital on November 10th, 2020

Selling Preventive Maintenance as a Value Add

Selling preventive maintenance is not what it used to be. In the old days a manufacturer could use its expert position to prescribe a maintenance scheme. Today, a combination of emerging technologies and pressure from buyers to do it cheaper/ smarter warrant a revisiting of the value proposition of preventive maintenance.

PM = Periodical Maintenance

As acronym we use PM. When talking we utter the words preventive maintenance. But what do we really mean?

  • Planned Maintenance
  • Periodical Maintenance
  • Predictive Maintenance
  • Prescriptive Maintenance

Analysing a lot of service contracts offered by OEMs we still see most of the maintenance is periodical or counter based. Just like the maintenance interval for your car; a PM each year or at 15,000 km.

All those periodical or counter based maintenance jobs are good service revenue for your service organisations But what happens when customers start challenging you? What if the customer has access to knowledge that amends or contradicts the engineering assumptions that led to the definition of your current maintenance intervals?

Buyers seek to reduce maintenance cost

In a world where people are more vocal, we see customers expecting things to work and buyers seeking to reduce maintenance cost. These expectations impact the way we sell service contracts. 

Selling is more straight forward when you can see a direct relationship between the pain and the gain. Such a link is obvious for installation and break-fix activities. But it is less apparent for preventive maintenance. Try to picture buyers asking these questions:

  • What does PM prevent and what is the risk that remains?
  • What is the rationale of the current maintenance interval?
  • Nothing happened last year. What will happen if we skip or delay a PM?
  • Can you dissect the PM job in activities (show me what you do) and is it really necessary to have all those activities done by an experienced/ expensive technician as yours?
  • Can we do pieces of the PM job ourselves?

You get the gist of the conversation and know where it is leading  less cost for your customer at the expense of less PM revenue for your service organisation.

Problem-Fix curve

What complicates the selling of service, is that in most scenarios the buyer and the customer/ user are not the same person. You may convince the user of a piece of equipment to do preventive maintenance, the buyer on the other hand has a different set of objectives. Most likely the buyer will push you on a path towards commoditising and cannibalising your PM services. All in order to reduce cost.

Rediscovering value

To stay ahead of the game let’s dissect PM along the lines of value creation for the customer. High level you can split a PM into three pieces:

  1. The execution of the maintenance activities
  2. The reporting on those activities
  3. The communication and interpretation of the results

Ask your customers to rate the value of each of those pieces. It’s probable that you will find that the business value of PM to a lesser extent is in the execution and more in the reporting and communication.

Maybe you pride yourself in your uniqueness of execution, whereas the customer might perceive it as a commodity. If also reporting and communication are on par, you may face price erosion.

If your customer needs the PM report for compliance or insurance purposes, the value of the report increases. When you consider that PM is often a play of risk and liability, you can price the value of your brand. Example: It does make a difference to an insurer if a yearly PM/ inspection is performed by a triple A company or a middle of the road company.

Communication value comes into play when your customer expects you to be a partner rather than a supplier. 

  • Supplier – “just send me the PM report, I’ll read and interpret it myself. When I need assistance, I’ll contact you.”
  • Partner – “help me interpret the findings and consequences of the PM. How does this impact my business?”.

In the latter situation you can monetise the communication beyond the effort of having a conversation for a couple of hours. PM can thus elevate from an obligatory periodical execution to an instrument of customer satisfaction and cross- and upselling.

Repackaging the preventive maintenance offering

In order to retain and expand your PM revenue stream in a context where the buyers move to reduce their spend, do go in discovery mode and (re)define preventive maintenance. PM is not a singular black box once defined by somebody in engineering with a product focus. Modern PM is a menu of choices (and consequences) for your buyer based on the usage profile of the product, budget and risk.

This article is published in Field Service News Jan/Feb 2020 issue.

Measuring Satisfaction: read the comments

What is the ideal customer experience and when do you know you got it right? What should you measure and how should you act? In short: read the comments! As a bonus: do an e-NPS.

The real growth power of NPS is all in the follow-up

Chad Keck

At Maximize Chicago Stephan McPhee from MilliporeSigma and Coen Jeukens from ServiceMax engaged in a discussion with service leaders on the topic of CSAT, CES and NPS. In varying degrees, we all measure customer experience. Though the different metrics may cause confusion in what you actually measure and should do.

What is the ideal customer experience?

If we briefly put aside the metric and look at what (end) customers really want, two things really stand out.

  • Get what you Expect
  • Walk the Talk

The former means a customer is getting the value it has been promised, the latter ensures the delivery is done consistently and setup for repetition.

Different methods of measuring

To measure customer satisfaction three different metrics are in use. Each catering to a different aspect of satisfaction.

  • NPS: will you recommend my brand?
  • CSAT: are you happy with the transaction I just performed?
  • CES: how easy is it to do business with me?

At present the most popular metric is NPS. Aly Pinder from IDC Manufacturing Insights shared his observation that more and more organisations are leaning towards Customer Effort Score as it addresses the action to remove friction, alias dissatisfaction.

Perhaps what you measure is what you get. More likely, what you measure is all you’ll get. What you don’t (or can’t) measure is lost.

H. Thomas Johnson

Read the comments

Ultimately the actionable result of any satisfaction metric is the most important piece of the process. Throughout the discussion at Maximize the same phrase came back over and over again: “read the comments”.

The numerical value of a satisfaction measurement is single dimensional: it tells you “what” your score is and how it changes over time. The comments to the score tell you about the “why”. Often the comments contain “free advice” on how to remedy dissatisfiers.

In progressive organisations we see an embedded process to review the comments on a periodical basis, linked to their continuous improvement programme.

e-NPS

While most organisations have embedded customer satisfaction measurements in their modus operandi, a growing number of organisations is mirroring the NPS philosophy to their own employees.

Your own employees hold an invaluable wealth of improvement opportunities. Ideas to improve their own work and to be better equipped when dealing with customers. If you find a way to tap into this potential, you will see that happy employees indeed make happy customers.

Happy employees ensure happy customers. And happy customers ensure happy shareholders, in that order

Simon Sinek (leadership expert)

If you want to receive more insights into how ServiceMax embeds satisfaction measurements into every aspect of Service Execution, do contact us.

This article is published in ServiceMax Field Service Digital on November 14th, 2019

Are Service Metrics the New Economic Barometer?

For decades the OECD[1] has been reporting a global productivity decline, while at the same time we see a rise in GDP. This triggers the question: Should the productivity metric should be augmented with more contemporary metrics in policy making and business decisions? Today we see the disruption of anything-as-a-service business models. Its success is powered by underlying service metrics.

Where productivity predominantly focusses on the efficiency of producing a product, service metrics focus on how that product is being utilised. Understanding and optimising a product’s use creates new revenue streams boosting our economy.

Responding to Volatility

Service metrics have been around for decades, only to gain more traction as other metrics fail to paint a complete picture for decision makers. Decision makers face a volatile environment with rapidly changing customer behaviour and technology. Today we must explain to customers that apart from selling an excellent product, we provide services that enable the end user to drive value from that product. Instead of the product being the goal, the product is a means to an end. More and more we’re moving towards buying the outcome of a product over owning the product.

“Velocity and scale of adoption are coming faster, making service metrics (availability, uptime, reliability) strategic to growth & success1.”

After-Sales Has Always Known

Initial product purchase relative to total product lifecycle cost

Research from Accenture[2] shows that between 8 and 12% of the life cycle cost are related to the purchase of a product. The rest of the costs are incurred during the operational phase of a product. It is typically the after-sales department that provides services during this phase. In doing so, after sales has many touch points and has a pretty good idea how the customer is using the product. In performing the services throughout the product lifecycle, after-sales generates many service metrics. The big opportunity is to use these metrics beyond the operational aspects of delivering the services.

Maturing of Service Metrics

The effectiveness of service metrics depends on the maturity of your service organisation. If you only provide break-fix and spare part services in a reactive mode, the available metrics will have a lesser potential to influence your business strategy then when selling output/ outcome-based services. For the latter, having a thorough understanding of all cost and revenue drivers is essential. The common demeanour is that service metrics drive new insights and those insights can be turned into new revenue opportunities. Zeithami[3] et al illustrate in their continuum how your services portfolio will change when maturing and shifting the focus from product to its use.

Zeithami continuum

Installed Base Penetration

Let me illustrate the maturing of a service metric and its impact on your business model. Does your organisation know where products go after they have been sold? Do you keep track of reactive and preventive maintenance activities per installed product? Do you keep track of modifications and retrofits to installed products?

When you invest in installed base understanding and connect the dots with all activities that relate to the installed product, each iteration you generate more insights to do the job better, faster and cheaper. As a result, you build trust and satisfaction with your customer. In return, the customer will tell you more about his business and how you can create more value by means of offering more and upscale services. The more you are connected to the dynamics of your customer, the more reliable your economic barometer.

From Data Consumer to Data Supplier

What you see happening in the example of installed base penetration is that after-sales is transitioning from data consumer to data provider. To deliver basic services, after-sales builds on product related info such as the as-built and warranty clauses. In delivering services, after-sales collects data on the usage of the product creating a wealth of insights from the as-maintained. The insights created from service metrics can feed both product development and market development, resulting in better products and relevant propositions driving sustainable economic growth.

Outcome Economy

On sustainable economic growth, the World Economic Forum[4] describes the outcome economy as a phase where “companies will shift from competing through selling products and services, to competing on delivering measurable results important to the customer”. This requires “a deeper understanding of customer needs and contexts in which products and services will be used”. Service metrics cater to this deeper understanding of both product and customer behaviour. It is technology, digitisation and state-of-the-art field service management tooling that drives the maturing of service metrics in both scale and real-time. Having this data at your fingertips supports situational and holistic decision making. In other words, product related services for commodity buyers and outcome-based services for value buyers.

Service Metrics as an Economic Barometer

Whether it is the maturing of the after-sales domain or the customer shift from owning a product to generating value of its use, service metrics are at the heart of both. The dotcom revolution has shown us that productivity does not have the same relevance in the automated, servitised Industrial Internet business landscape. Today, we live in a data driven economy. He/she who masters data has a competitive advantage. Service Metrics play into that game.

“It’s about unlocking data to turn valuable insights into powerful business outcomes[5].”

After-Sales Paradigm Shift

After-sales traditionally has not been a business function with a voice in strategic decision making[6] – despite contributing significantly to the margin of the organisation. With the growing value of service metrics after-sales has the potential to become a provider of valuable and strategic insights. This is a paradigm shift for the entire organisation. Productivity has its place, but pay attention to the service metrics as an economic barometer.

This article is published in ServiceMax Field Service Digital on January 8th, 2020


[1] OECD Compendium of Productivity Indicators 2017, ISBN 9789264273252

[2] Accenture 2001, Equipment Today, Service Tomorrow – the total cost of ownership vision

[3] Zeithami, Brown, Bitner and Salas 2014

[4] World Economic Forum – Industrial Internet of Things: Unleashing the Potential of Connected Products and Services 2018 – Chapter 3: Convergence on the outcome economy

[5] GE Digital strategic focus 2018, Bill Ruth

[6] VansonBourne 2016, The challenges, benefits and future opportunities of field service management

Battery Gate

The dust is settling over Battery Gate. I’ve heard many woes and seen people in disbelief. Is this really happening? Is a mobile phone the only product affected? Social media exploded with conspiracy theories and various law firms have started class actions. What can we learn from Battery Gate?

AppleNews

Sales and After-Sales

A relationship between Supplier and Customer starts with an initial sale. With array of tools Suppliers bid for repeat purchases:

  • Dazzle them: Brand/ customer loyalty
  • Force them: Technology/ customer lock-in
  • Convince them: Maintenance & Value-added Services
  • Help them: Operate & Ease-of-use Services

In the case of the phone we can see multiple types of product related repeat purchases:

 RevenueWhen
New phone$999.00In x years
Extended warranty$199.00Point of sale
Battery replacement$79.00Approx. after 2 years

In this example the supplier drives its revenue figures through product sales and has little incentive to lengthen the life cycle of the product. After-sales revenues even jeopardize future product sales. 

Many OEM’s/ Manufacturers will find themselves in exactly the same position: after-sales revenues are a welcome addition to sales revenues as long as they don’t compete.

Doing the right thing

So, what is “doing the right thing”? In case of Battery Gate consumers got the impression that the supplier was purposefully reducing the product life cycle, thus forcing earlier product repurchases. We’ll probably never know all supplier considerations in their course of action, we do know Battery Gate back fired … to a certain degree. Analysts predict that the supplier may see “mild headwinds” (see inset).

When considering “doing the right thing” from the customers perspective, the concept of Total Cost of Ownership (TCO) could come into play: the optimum of both the initial/ capital sale and the operational expenditures throughout the life cycle.

Does this mean we would rather buy a phone with a longer life span and user replaceable parts? I guess here we must make the distinction between “needing” and product and “wanting” a product. If you want the new functions and features you’ll probably forgive the supplier. Your repeat purchase will be the next product. If you need the product to generate output and outcome for your organization, you’ll drive your supplier, or third-party maintainer, to deliver after-sales services.

Loyalty

Would a Battery Gate in your industry impact your NPS and revenue stream? Would the headwinds be negligent, mild or violent? I believe being honest and transparent is your route to loyalty and repeat revenue.

Field Service Asia – Is Asia willing to pay for Service?

Sentosa Island was the backdrop for the first Field Service event in Asia. More than 120 delegates came to Singapore to participate in discussions and get a feel of the field service buzz. Many had heard their European or American colleagues talking about the US & EU editions and were encouraged to join the debate.

On the tip of the tongue was this one question: “Is the Asian customer willing to pay for Service?” Closely followed by “on a maturity scale, how do we compare?”

AsiaServiceMaturity

The two questions are interlinked. In the same country and sometimes with the same customer it makes a significant difference how you both define and position service. If service is more focused on the Product, the Asian customer is less inclined to pay for service. This is most visible in the Japanese culture where Product related service is pinned to Quality: if the product breaks, something is wrong with quality … and the supplier must fix it … at his cost.

FSAsiaAttendence

Despite all the cultural differences, most delegates agree that the basic field service business processes are more universal. A product breaks, the customer has an expectation and calls, the supplier fixes the product resulting in a customer satisfaction/ experience. For these service basics there is a lot of transformation going on. 

The transformation specifics unfold in building a business case. Three country specific attributes impact both the cost and the return:

  • Labor cost
  • Geographical spread and logistics capabilities/ cost
  • Local legislation, trade & sector barriers
ServicesScale

At the first Field Service event in Asia delegates have engaged with each other, thought leaders and field service tool providers. There is an overwhelming consensus on the value field service is providing to the organization and its customers. Going home, the promise of service transformation towards the future is even bigger. 

Adding the core message on “ownership” from the TEDx speaker Andrew Bryant, maybe we should rephrase the opening question: “When are we willing to pay for Service”. Make the question personal and dive into your own deliberations. If you can frame your service message more on the Customer side than on the Product side, I believe any customer will pay for Service.

This article is published in ServiceMax Field Service Digital on November 21st, 2017