What is the ideal customer experience and when do you know you got it right? What should you measure and how should you act? In short: read the comments! As a bonus: do an e-NPS.
The real growth power of NPS is all in the follow-up
Chad Keck
At Maximize Chicago Stephan McPhee from MilliporeSigma and Coen Jeukens from ServiceMax engaged in a discussion with service leaders on the topic of CSAT, CES and NPS. In varying degrees, we all measure customer experience. Though the different metrics may cause confusion in what you actually measure and should do.
What is the ideal customer experience?
If we briefly put aside the metric and look at what (end) customers really want, two things really stand out.
Get what you Expect
Walk the Talk
The former means a customer is getting the value it has been promised, the latter ensures the delivery is done consistently and setup for repetition.
Different methods of measuring
To measure customer satisfaction three different metrics are in use. Each catering to a different aspect of satisfaction.
NPS: will you recommend my brand?
CSAT: are you happy with the transaction I just performed?
CES: how easy is it to do business with me?
At present the most popular metric is NPS. Aly Pinder from IDC Manufacturing Insights shared his observation that more and more organisations are leaning towards Customer Effort Score as it addresses the action to remove friction, alias dissatisfaction.
Perhaps what you measure is what you get. More likely, what you measure is all you’ll get. What you don’t (or can’t) measure is lost.
H. Thomas Johnson
Read the comments
Ultimately the actionable result of any satisfaction metric is the most important piece of the process. Throughout the discussion at Maximize the same phrase came back over and over again: “read the comments”.
The numerical value of a satisfaction measurement is single dimensional: it tells you “what” your score is and how it changes over time. The comments to the score tell you about the “why”. Often the comments contain “free advice” on how to remedy dissatisfiers.
In progressive organisations we see an embedded process to review the comments on a periodical basis, linked to their continuous improvement programme.
e-NPS
While most organisations have embedded customer satisfaction measurements in their modus operandi, a growing number of organisations is mirroring the NPS philosophy to their own employees.
Your own employees hold an invaluable wealth of improvement opportunities. Ideas to improve their own work and to be better equipped when dealing with customers. If you find a way to tap into this potential, you will see that happy employees indeed make happy customers.
Happy employees ensure happy customers. And happy customers ensure happy shareholders, in that order
Simon Sinek (leadership expert)
If you want to receive more insights into how ServiceMax embeds satisfaction measurements into every aspect of Service Execution, do contact us.
For decades the OECD[1] has been reporting a global productivity decline, while at the same time we see a rise in GDP. This triggers the question: Should the productivity metric should be augmented with more contemporary metrics in policy making and business decisions? Today we see the disruption of anything-as-a-service business models. Its success is powered by underlying service metrics.
Where productivity predominantly focusses on the efficiency of producing a product, service metrics focus on how that product is being utilised. Understanding and optimising a product’s use creates new revenue streams boosting our economy.
Responding to Volatility
Service metrics have been around for decades, only to gain more traction as other metrics fail to paint a complete picture for decision makers. Decision makers face a volatile environment with rapidly changing customer behaviour and technology. Today we must explain to customers that apart from selling an excellent product, we provide services that enable the end user to drive value from that product. Instead of the product being the goal, the product is a means to an end. More and more we’re moving towards buying the outcome of a product over owning the product.
“Velocity and scale of adoption are coming faster, making service metrics (availability, uptime, reliability) strategic to growth & success1.”
After-Sales Has Always Known
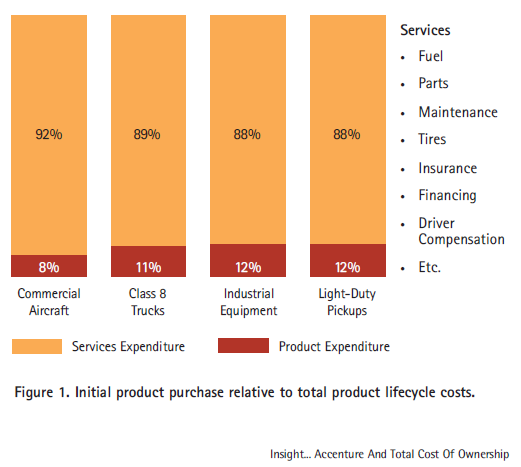
Research from Accenture[2] shows that between 8 and 12% of the life cycle cost are related to the purchase of a product. The rest of the costs are incurred during the operational phase of a product. It is typically the after-sales department that provides services during this phase. In doing so, after sales has many touch points and has a pretty good idea how the customer is using the product. In performing the services throughout the product lifecycle, after-sales generates many service metrics. The big opportunity is to use these metrics beyond the operational aspects of delivering the services.
Maturing of Service Metrics
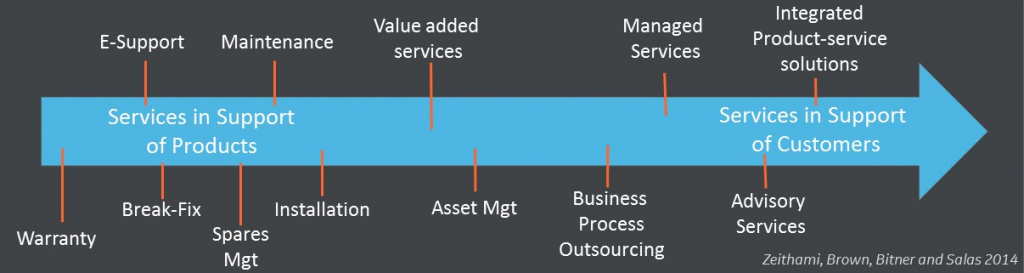
The effectiveness of service metrics depends on the maturity of your service organisation. If you only provide break-fix and spare part services in a reactive mode, the available metrics will have a lesser potential to influence your business strategy then when selling output/ outcome-based services. For the latter, having a thorough understanding of all cost and revenue drivers is essential. The common demeanour is that service metrics drive new insights and those insights can be turned into new revenue opportunities. Zeithami[3] et al illustrate in their continuum how your services portfolio will change when maturing and shifting the focus from product to its use.
Installed Base Penetration
Let me illustrate the maturing of a service metric and its impact on your business model. Does your organisation know where products go after they have been sold? Do you keep track of reactive and preventive maintenance activities per installed product? Do you keep track of modifications and retrofits to installed products?
When you invest in installed base understanding and connect the dots with all activities that relate to the installed product, each iteration you generate more insights to do the job better, faster and cheaper. As a result, you build trust and satisfaction with your customer. In return, the customer will tell you more about his business and how you can create more value by means of offering more and upscale services. The more you are connected to the dynamics of your customer, the more reliable your economic barometer.
From Data Consumer to Data Supplier
What you see happening in the example of installed base penetration is that after-sales is transitioning from data consumer to data provider. To deliver basic services, after-sales builds on product related info such as the as-built and warranty clauses. In delivering services, after-sales collects data on the usage of the product creating a wealth of insights from the as-maintained. The insights created from service metrics can feed both product development and market development, resulting in better products and relevant propositions driving sustainable economic growth.
Outcome Economy
On sustainable economic growth, the World Economic Forum[4] describes the outcome economy as a phase where “companies will shift from competing through selling products and services, to competing on delivering measurable results important to the customer”. This requires “a deeper understanding of customer needs and contexts in which products and services will be used”. Service metrics cater to this deeper understanding of both product and customer behaviour. It is technology, digitisation and state-of-the-art field service management tooling that drives the maturing of service metrics in both scale and real-time. Having this data at your fingertips supports situational and holistic decision making. In other words, product related services for commodity buyers and outcome-based services for value buyers.
Service Metrics as an Economic Barometer
Whether it is the maturing of the after-sales domain or the customer shift from owning a product to generating value of its use, service metrics are at the heart of both. The dotcom revolution has shown us that productivity does not have the same relevance in the automated, servitised Industrial Internet business landscape. Today, we live in a data driven economy. He/she who masters data has a competitive advantage. Service Metrics play into that game.
“It’s about unlocking data to turn valuable insights into powerful business outcomes[5].”
After-Sales Paradigm Shift
After-sales traditionally has not been a business function with a voice in strategic decision making[6] – despite contributing significantly to the margin of the organisation. With the growing value of service metrics after-sales has the potential to become a provider of valuable and strategic insights. This is a paradigm shift for the entire organisation. Productivity has its place, but pay attention to the service metrics as an economic barometer.
[4] World Economic Forum – Industrial Internet of Things: Unleashing the Potential of Connected Products and Services 2018 – Chapter 3: Convergence on the outcome economy